
User manual
Input
To perform overrepresentation analysis of metabolite annotations with MBROLE you have to:
- Provide a set of compounds.
- Select the annotations (vocabularies) you want to analyse.
- Provide a background set.
You can test the server right away with a provided example by clicking the Load example button at the Analysis section.
Compound set
The compound set is a list of compounds you are interested in (e.g. a set of metabolites identified in your experiment). Either you can copy/paste a list of IDs, or upload a file (MBROLE expects tabs or new lines as ID separators).
See the Conversion section of this manual for further information on supported IDs.
Annotations
Select the vocabulary (or vocabularies) of biological and/or chemical annotations you want to use for the enrichment analysis. You can include a whole category by clicking on its name (in bold) or individual items within it. Use Ctrl+click to add more than one annotation at a time. You can also search for annotations by typing in the box. Those annotations already selected will appear in lighter color. To remove an annotation/vocabulary from the list press in the "x" besides it.
These are the current annotation vocabularies provided by MBROLE, classified in the same hierarchy used in the input form:
- Pathways
- Pathways: from BioCyc, SMPDB, UniPathway and KEGG
- Modules from KEGG.
- Interactions
- Enzime interactions: from KEGG, ECMDB, YMDB and BioCyc.
- Protein interactions: from Matador, HMDB, BioCyc, ECMDB and YMDB.
- Other interactions from KEGG.
- Roles
- ChEBI roles (biochemical, chemical and application).
- HMDB biofunctions.
- KEGG roles.
- Locations
- Tissue: from HMDB (e.g. Bladder or Bone Marrow).
- Biofluid: from HMDB (e.g. Blood or Urine).
- Cellular: from YMDB, ECMDB and HMDB.
- Drugs
- Indication from DrugBank.
- Pharmacological actions from MeSH.
- Diseases: from CTD and HMDB.
- Anatomical Therapeutic Chemical Classification system (ATC code) from MATADOR.
- Chemical classification
- Chemical Taxonomy: from YMDB and HMDB.
- MeSH hierarchy.
- LipidMaps taxonomy.
- KEGG classification.
Background set
MBROLE needs a background set of compounds to compute statistics. This background set is a reference used for assessing the significance of a given annotation to be enriched in your compounds of interest.
A given annotation could have a high frequency in your set of compounds simply because it is frequent in the whole metabolome. This is why a reference set is needed for assessing significance. This background set should contain all the compounds that could hypothetically be identified in your experiment (in a global profiling experiment, the background set will correspond to the whole metabolome).
Therefore, you can choose which type of background set is better depending on your data and/or the information you want to obtain:
- Full database: MBROLE will use as background all the compounds in the database(s) associated to the selected annotations.
- Organism-dependent: MBROLE will use the compounds associated to the selected organism as background set, only for annotations from KEGG and BioCyc. For the rest of annotations, the background will be all the compounds in the corresponding database.
- Use my own background set: paste a list or upload a file with the IDs you want to use as background (see Supported compound IDS for further information on supported IDs).
Once these fields in the input form are completed, press the Enrichment analysis button. If an error is found in the input, a red text box shows up at the top describing it.
It is also possible to use MBROLE as a generic database of metabolite annotations and retrieve the annotations available for your input set in the selected vocabularies (i.e. without performing enrichment analysis). For that, use the Search annotations button.
Results
MBROLE will display all the results in a single table which can be sorted by clicking on its headers. Each annotation (keyword) will be arranged in a row with several columns containing all the information:
- Annotation shows the annotation (keyword) itself and, if available, a link to its entry in the source database.
- Category shows which annotation vocabulary the keyword belongs to (take a look at the classification of annotation vocabularies in the Annotations section of the user manual).
- Set shows the number of compounds in your input that have annotations in that category.
- In set shows the number of your compounds that have this particular annotation.
- p-value of the enrichment analysis test for that annotation. It is calculated using the values from Set and In set columns and two additional values (Background and In background) that are shown when you put the mouse over the corresponding Category.
- FDR correction shows the adjusted p-value calculated as False Discovery Rate (FDR).
- Submitted IDs Shows those IDs from your set with that particular annotation (keyword).
- Matching IDs Shows the ID conversions of the previous ones required to retrieve this particular annotation vocabulary. For example, KEGG does not have information on metabolite-protein interactions. Hence, if the user provides KEGG IDs as input, these are converted to ECMDB IDs for retrieving these interactions.
The following two columns show up if you select "Show compounds in results table" at the top of the page.
Note that columns 3 and 4 will appear only when you perform an enrichment analysis (not when you click on Search for annotations). In the tutorial section there are few examples of MBROLE results
MBROLE computes the statistical significance of each annotation found in the set of compounds, taking into account the background set. This is provided as a p-value, or the probability of obtaining such a number (or more) of those compounds with a particular annotation in case we take a random set of the same size from the background set.
This p-value is also adjusted for multiple testing using the false discovery rate (FDR) method by Benjamini and Hochberg (1995)*. Both, p-value and adjusted p-value are reported for each annotation and, when possible, annotations and compound IDs are hyperlinked to their corresponding source database.
In the case of KEGG, the compounds of the input set are highlighted in the pathway representation generated by the hyperlink. Representations of the molecular structures of the compounds show up when the mouse is over the compounds IDs (if these are available). P-values are colored based on their significance level, (green for values <0.001; red for values ≥0.05 and orange for the rest). Put the mouse over each "Category" cell and it'll show the number of metabolites used as background as well as the number of associated metabolites found in it. You can see an example of this in Fig.2 of the Tutorial
For practical purposes MBROLE only shows those annotations found in 3 or more metabolites of the input set. A full version of the results table can be downloaded in tabular format for being further processed with any spreadsheet program ("Download full table" button). This includes also the annotations with less than 3 instances.
Conversion
MBROLE now performs an automatic conversion of the IDs submitted while searching for annotations so the user can get annotations from different databases in one single analysis without requiring previous conversion steps. Additionally, MBROLE includes a conversion utility which allows chemical names and more IDs from publicly available resources (as PubChem or the Chemical Abstract Service) as input for converting to supported IDs. This utility is accessible via the "Conversion" link at the top of MBROLE pages
Compound IDs supported are those corresponding to databases imported by MBROLE, namely:
- KEGG (e.g. C00008 for ADP).
- HMDB metabolites (e.g. HMDB00064 for creatine).
- YMDB metabolites (e.g. YMDB00003 for urea).
- DrugBank drugs (e.g. DB00027 for Gramicidin D).
- MeSH concepts and descriptors (e.g. C000249 for benzylsuccinic acid).
- Lipid Maps lipids (e.g. LMFA01010001 for palmitic acid).
- BioCyc compounds (e.g. CPLX3O-77 for phosphofructokinase).
- ChEBI accessions (e.g. CHEBI:34590 for bromobutide).
- ECMDB metabolites (e.g. ECMDB00039 for butyric acid).
- PubChem Compounds.
Annotations
Current annotations available in MBROLE, classified according with the database they were obtained, are:
- Human Metabolome Database (HMDB) metabolites
- HMDB taxonomy: chemical classification according to HMDB, such as heterocyclic compound or inositol phosphates.
- Diseases: e.g. Obesity, Kidney disease, or Pyruvate dehydrogenase deficiency.
- Localization: in biofluid (e.g. Blood, Urine), tissue (e.g. Bladder, Bone Marrow, Neuron) or cellular (e.g. Extracellular, Membrane, Mitochondria).
- SMPDB pathways: information on biological networks from The Small Molecule Pathway Database.
- Biofunction: Short description of the main functions the metabolite is involved in.
- Protein interactions from UniProt.
- DrugBank drugs (low-MW molecules with pharmacological actions)
- Pathways from SMPDB in which the drug is involved.
- Drug category (therapeutical or general) such as antiviral agents, anticoagulants, antimucositis agents etc.
- Drug-Target information as its SMPDB pathway or UniProt ID.
- Drug indication: for what the drug is used.
- ChEBI accessions (only 3star compounds)
- Role: the role played by the compound or part thereof in three different contexts: biological (e.g. toxin, immunomodulator, antimicrobial agent), chemical (e.g. antioxidant, surfactant, acceptor) and application (e.g. agrochemical, pesticide, dye).
- UniPathway pathways: information on pathways from UniPathway.
- BioCyc compounds
- Pathways related to the metabolite and its possition in the biological network.
- Protein interactions of the metabolites including multi-type classifications: a procollagenase, a polipeptide or a glycogenin.
- MATADOR
- Protein interactions with chemical compounds.
- MeSH chemicals
- Pharmacological actions: a broad range of chemical actions and uses (e.g. Luminescent, Antineoplastic or Bronchodilator).
- MeSH taxonomy: hierarchichal classification of chemicals (D03 for Heterocyclic Compounds or D03.438.221 for Benzoxazoles).
- Lipid Maps
- Lipid Maps taxonomy: hierarchichal classification of lipids (GL for Glycerolipids or GL0301 for Triacylglycerols.
- Yeast Metabolome Database (YMDB) metabolites
- Localization: subcellular locations (e.g. extracellular, cytoplasm, nucleus).
- Pathways from SMPDB related to metabolites.
- YMDB taxonomy: chemical classification according to YMDB, such as ketones or imidazol.
- Protein and enzyme interactions: EC numbers and UniProt accession numbers.
- Kyoto Encyclopedia of Genes and Genomes (KEGG)
- Pathways: information on biological networks, mainly related to metabolism, such as galactose metabolism, oxidative phosphorylation and N-Glycan biogenesis.
- Enzyme interactions: relationships with enzymatic activities (Enzyme Commision numbers) as described in the KEGG REACTION database, such as 3.1.3.11, 2.7.1.17
- Other interactions: relationships with other protein activities as described in the BRITE hierarchy, mainly with transporters and receptors (e.g. ABC Transporters, Glutamate-gated cation channels).
- Biological role: as described in the BRITE hierarchy, e.g. carbohydrates, vitamins, hormones and transmitters...
- Drugs classification systems described in BRITE: antiinfectives, ATC classificaton or USP classification.
- Modules (Glycolysis, Ubiquitin system or Sterol metabolism).
- E. coli Metabolome Database (ECMDB) metabolites
- Localization: subcellular locations (e.g. extracellular, cytoplasm, nucleus).
- Pathways from SMPDB related to metabolites.
- Protein and enzyme interactions: EC numbers and UniProt accession numbers.
Release Notes
Current release (MBROLE version 2.0) analyzes annotations from the following releases of the databases:
- KEGG (Kyoto Encyclopedia of Genes and Genomes) release 54.1.
- HMDB (Human Metabolite Database) version 3.5.
- YMDB (Yeast Metabolite Database) version 1.0.
- PubChem release July 2014.
- BioCyc version 17.1
- Lipid Maps Updated Mar 18, 2014.
- MeSH (Medical Subject Heading) Updated Feb 25, 2014.
- DrugBank version 4.0.
- UniPathway Release Jan, 2014.
- ChEBI (Chemical Entities of Biological Interest) release 116 (June, 2014).
- Rhea (Chemical Entities of Biological Interest) release 47 (April, 2014).
- MATADOR version 1.0.
- ECMDB (E.coli Metabolome Database) version 1.0.
Tutorial
This tutorial will teach you how to perform a whole analysis with MBROLE. You can also use the "Load example" button to analyze an example dataset.
Example 1: Enrichment Analyisis
Let's suppose the outcome of our experiment is this set of 45 metabolites from Escherichia coli, and we are interested in analyzing which pathways and proteins related to these metabolites are enriched.
Upload the file containing the metabolite IDs or copy and paste them in the text area. Note that IDs should be separated by tabs or new lines.
Select in the "Annotations" section: "KEGG pathways", "Unipathway pathways" and "Protein interactions (from the ECMDB)".
In the section "Background Set" select "Organism dependent". A drop-down list with all the organisms available appears. Select "Escherichia coli O6:H1 CFT073 (UPEC)"
Click on the "Enrichment analysis" button to start the analyisis.
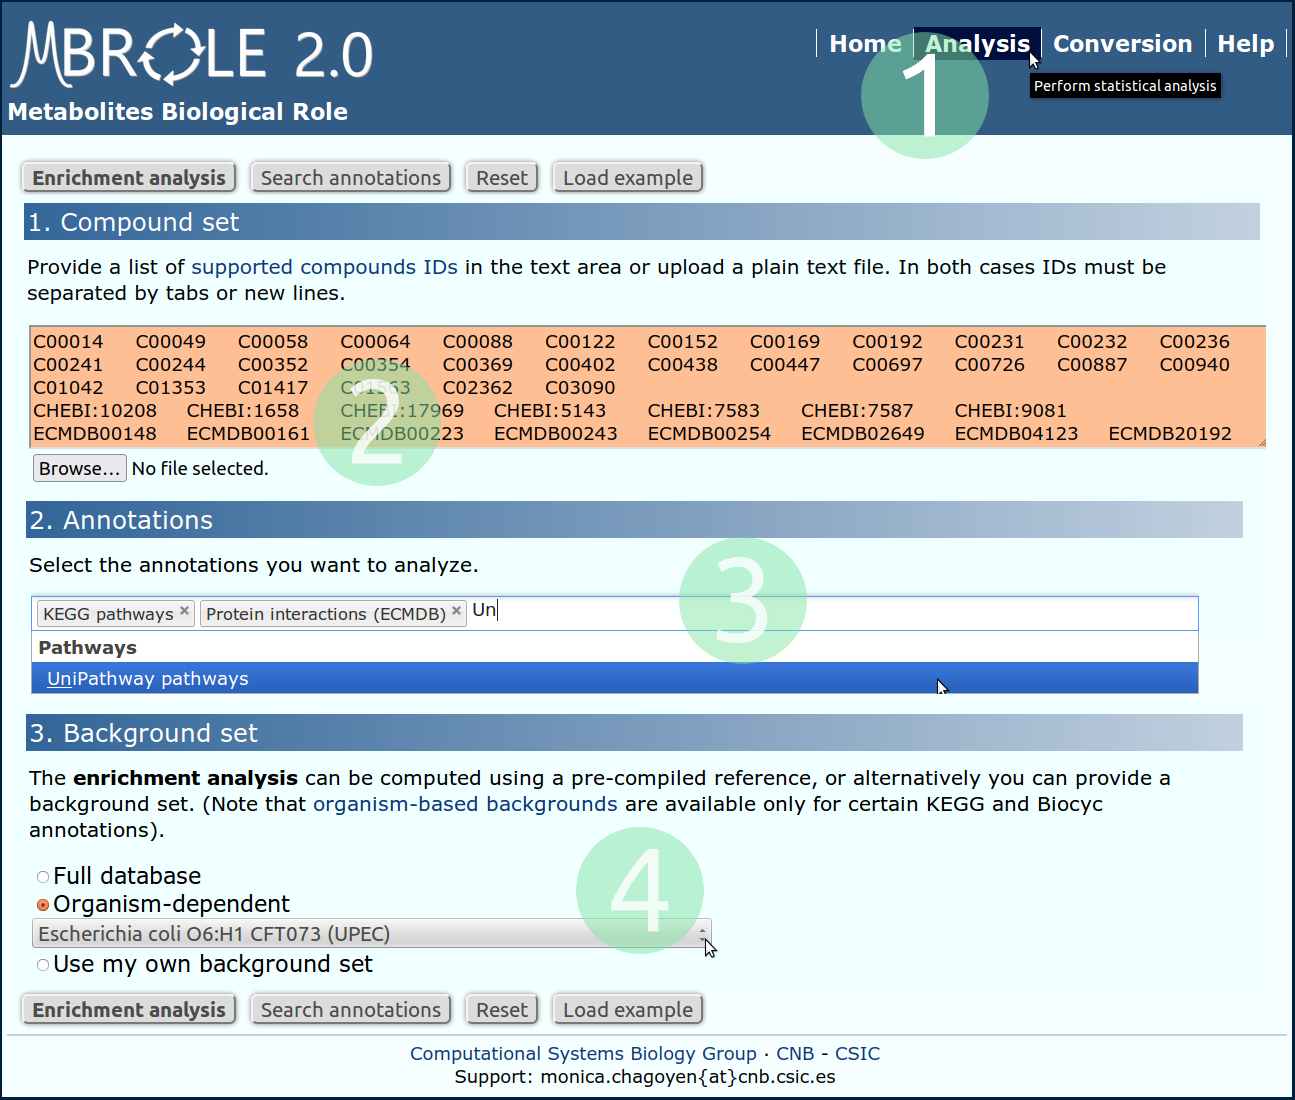
- Go to analysis page.
- Copy and paste or upload a local file with your set of compounds.
- Select the annotations you want to analyze.
- Choose "Escherichia coli O6:H1 CFT073 (UPEC)".
- Click on "Enrichment analysis".
Once calculations have finished, you will get a results table similar to that of Fig.2.
This page contains a table with six columns summarizing results. Each row contains information on a single annotation as it was explained in the Results section of the user manual.
In this case, by the enriched pathways and the type of proteins interacting with these metabolites it is clear that they are pointing to metabolic processes related to metabolism of nitrogen.
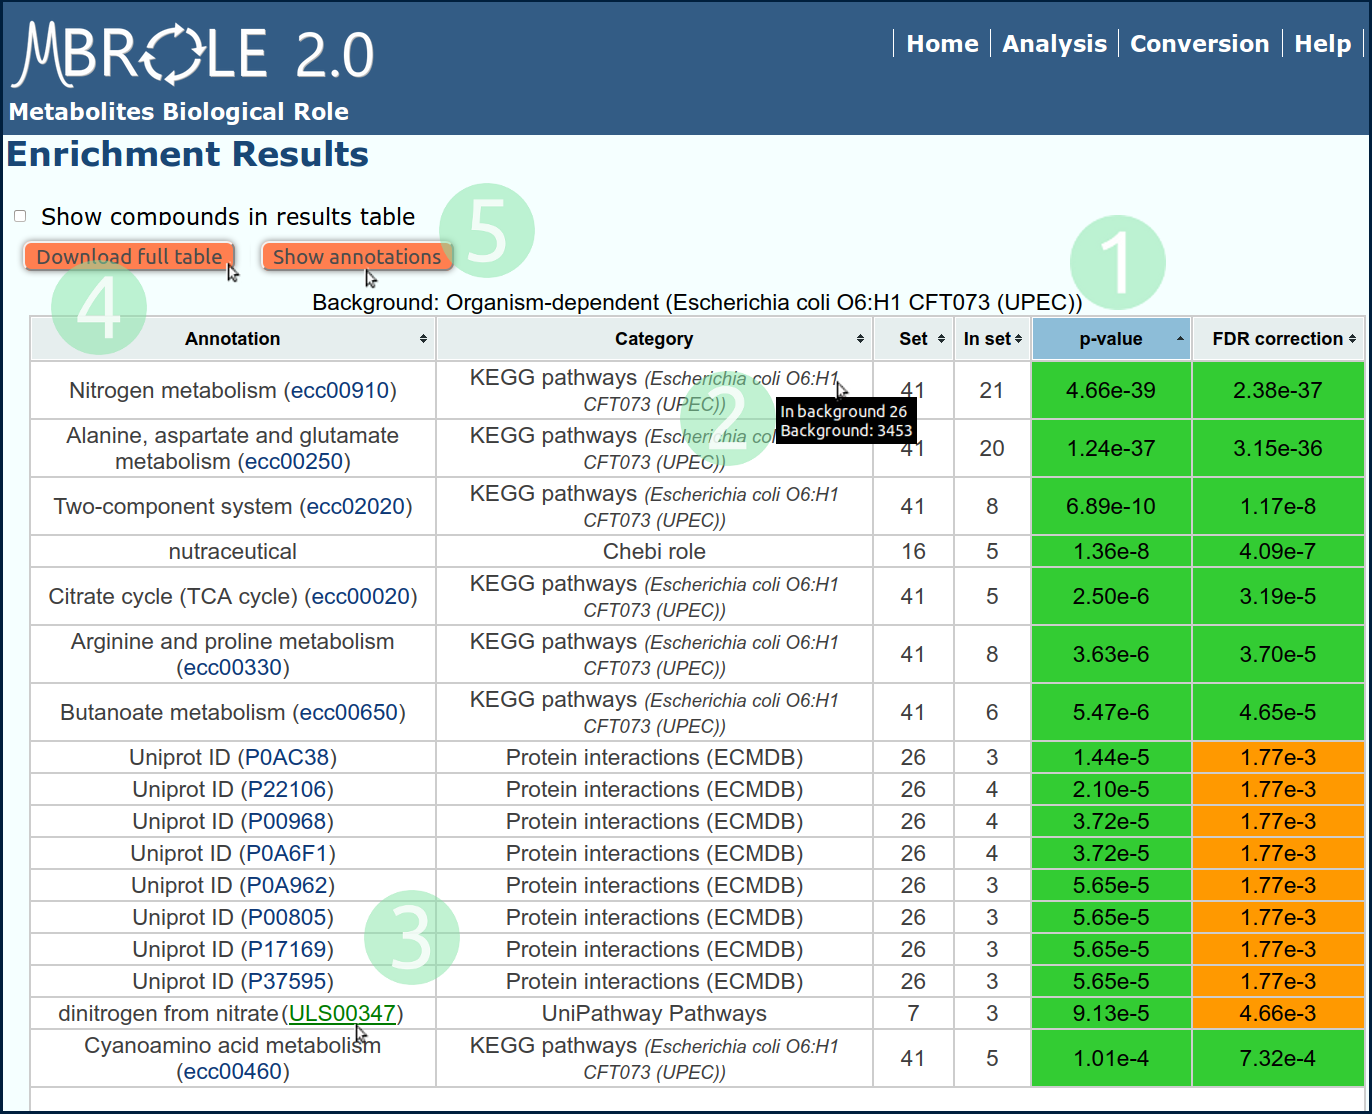
- Click on "p-value" header to sort out the table.
- Put the mouse over each "Category" to show info about the background.
- Follow the link of the annotation to open its content in the source database.
- Click on "Download result table" button to export all the results to a spreadsheet program.
- Click on "Show annotations" to see the annotations without the statistical analysis (Wich will be the same as doing Example 2).
Example 2: Annotation Search
In this case we will request only the annotations available for the previously used dataset. This could be useful, for example, to apply our own analysis method to the annotations of these metabolites.
As we did in the Example 1, paste or upload the list of compounds, select "KEGG pathways", "Unipathway pathways" and "Protein interactions (from the ECMDB)" in the "Annotations" section, Escherichia coli O6:H1 CFT073 (UPEC) from the "Organism-dependent" "Background" option and click the "Annotations search" button.
Results are split in different tables (one table for each group of annotations) accessible with the menu on the left. Click on Unipathway Pathways to show this group of annotations as it appears in Fig.3.
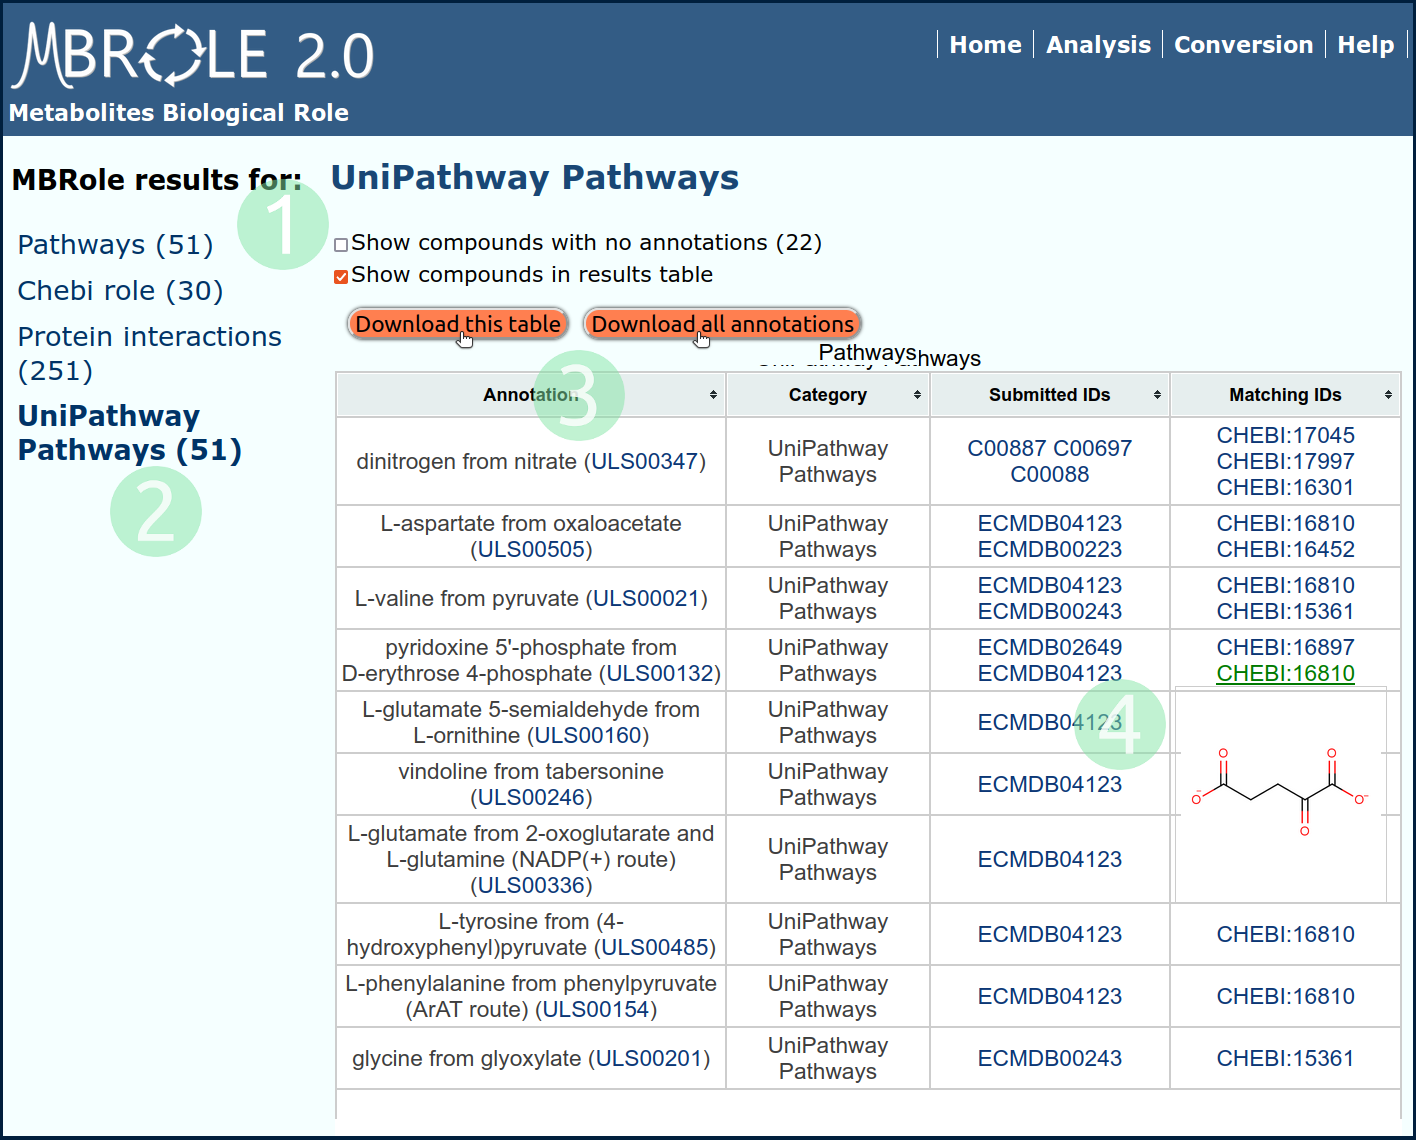
- This checkbox is checked by default. Click again to hide the "Submitted IDs" and "Matching IDs".
- Move to a different group of annotation clicking on the menu.
- Click on "Download" button to export the table on screen or click on "Download all annotations" to export all annotations in a single table.
- Move the mouse over some IDs to see an image of the corresponding compound structure.
Example 3: Conversion
This set of metabolites is given in terms of chemical names so they cannot be used directly in the analysis. In this example we will convert them to ECMDB, KEGG and ChEBI IDs so as to perform the analysis with them.
Go to the Conversion utility and upload the file or copy-paste its content and select: "ChEBI compounds", "ECMDB metabolites" and "KEGG compounds". After you click the "Search IDs" button you will get a result table like that in Fig. 4. This table includes for every submitted metabolite, the equivalent ID(s) and its source database.
This table can be downloaded as a tsv text file clicking on "Download results" button. Once checked that the name to ID conversion is ok (and eventually corrected), the column with the IDs of the compounds to analyse can be copied/pasted to the Analysis form.
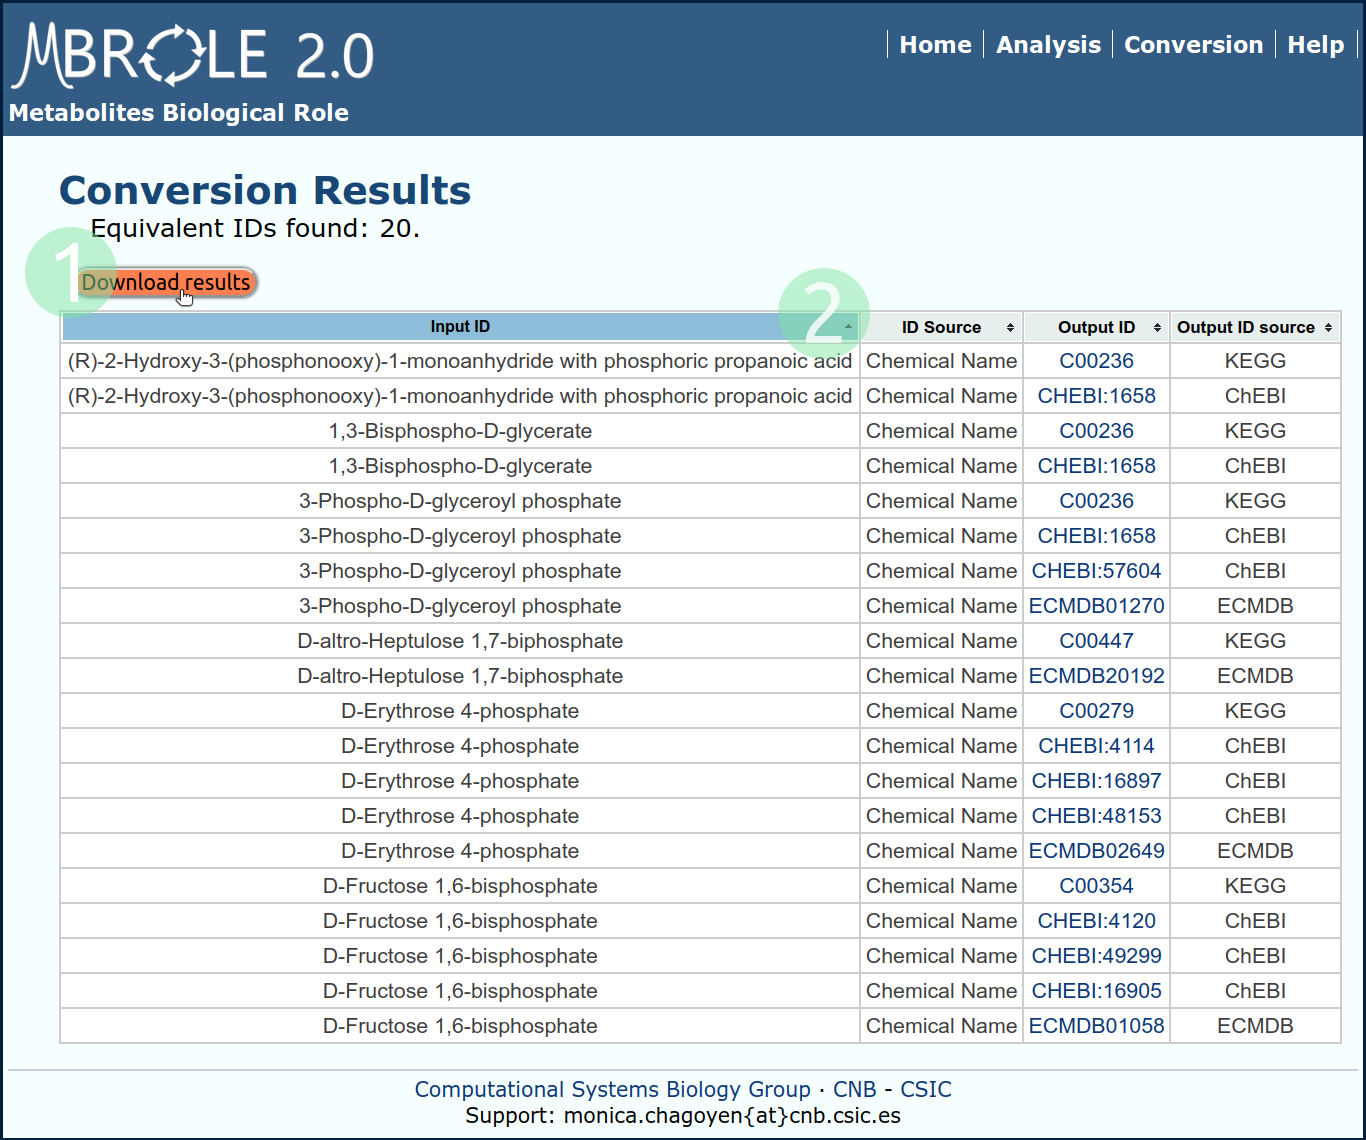
- Click on "Download results" to open the table with your favourite spreadsheet program.
- Clicking on headers will sort the table.