Tutorial

In this tutorial we aim to illustrate some of the features of the Mirrortree Server by using it for studying the co-evolution of two members of the Sox multienzyme complex, SoxA and SoxB. Co-evolution within this complex has been extensively studied in Gosh et al. and we will see how we can reproduce many results of that work by using the Mirrortree Server without requiring any expertise in phylogenetic tree generation, etc.
This example is already precalculated and you can access directly to the results.
We start by introducing in the main interface a sequence of a representative for each one of the two families. In this case we paste the sequences of SoxB (O67671_AQUAE) and SoxA (O67673_AQUAE) of Aquifex aeolicus (Figure 1). We introduce our email address and optionally a name for identifying the job and press "Send". A page appears confirming that the job has been successfully queued (Figure 1). In this page we also have the URL where the final results will appear as well as a job-id for tracking the job with the server administrators in case it fails. We can directly go to that URL and wait for the results to show up there. The URL is automatically refreshed every 30 secs until the results are ready. Alternatively, we can wait for the email we will receive when the results are ready, which contains the same URL.
The results page for this example is available here.
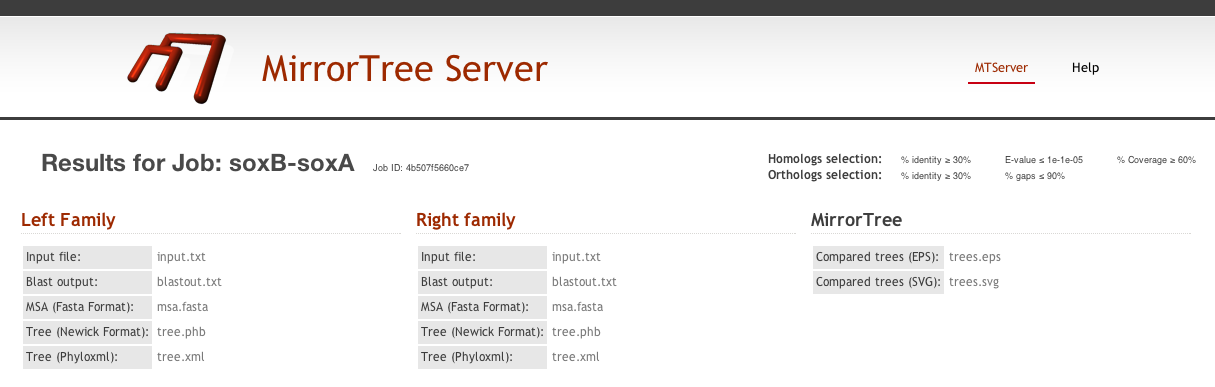
In this results page, there is a header with information on the submitted job and the parameters used (the default ones in this case). In this header we also have links to static representations of the mirroring tress (in .eps and .svg formats) and some intermediate results for the two families which can be useful (e.g. automatically generated multiple sequence alignments and tress) (Figure 2).
We maximize the browser window (or use the "full-screen" view of the browser) to better use the interface.
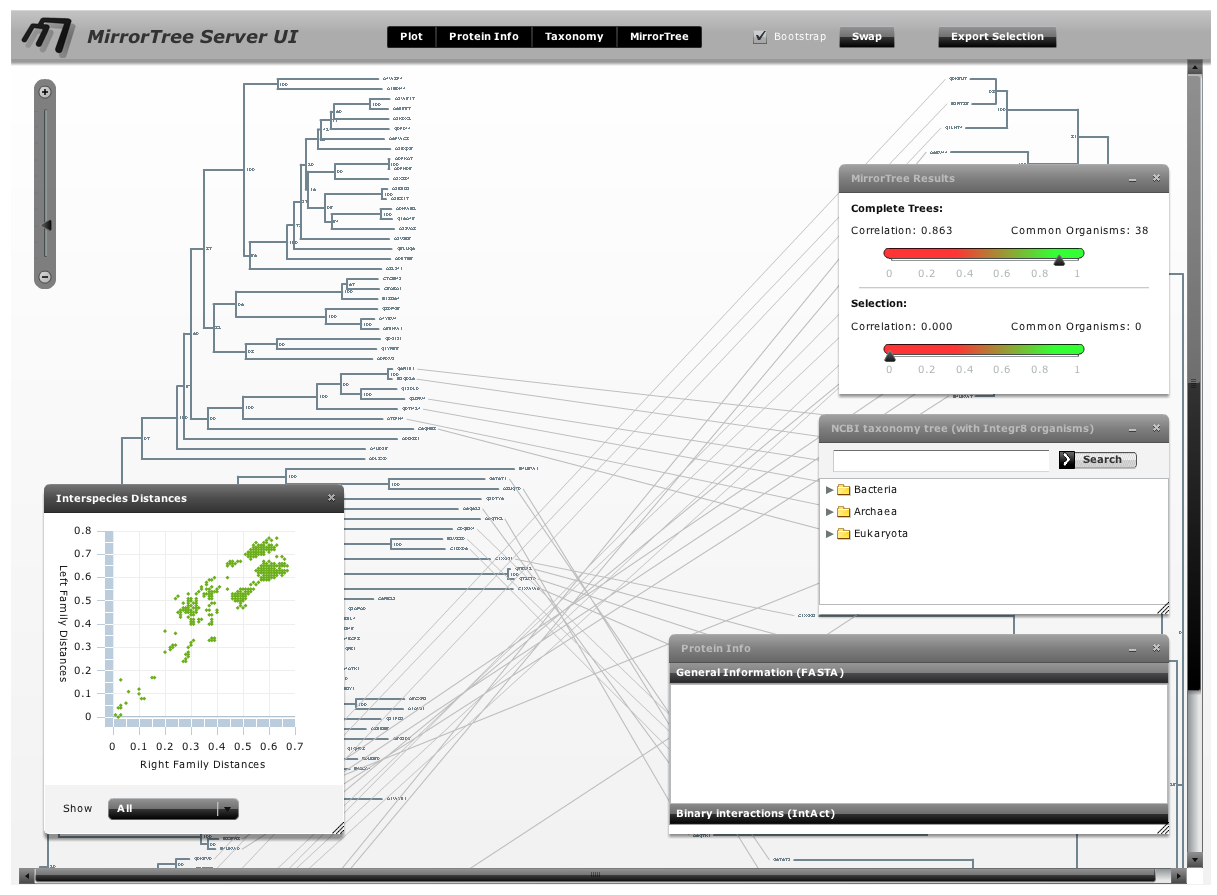
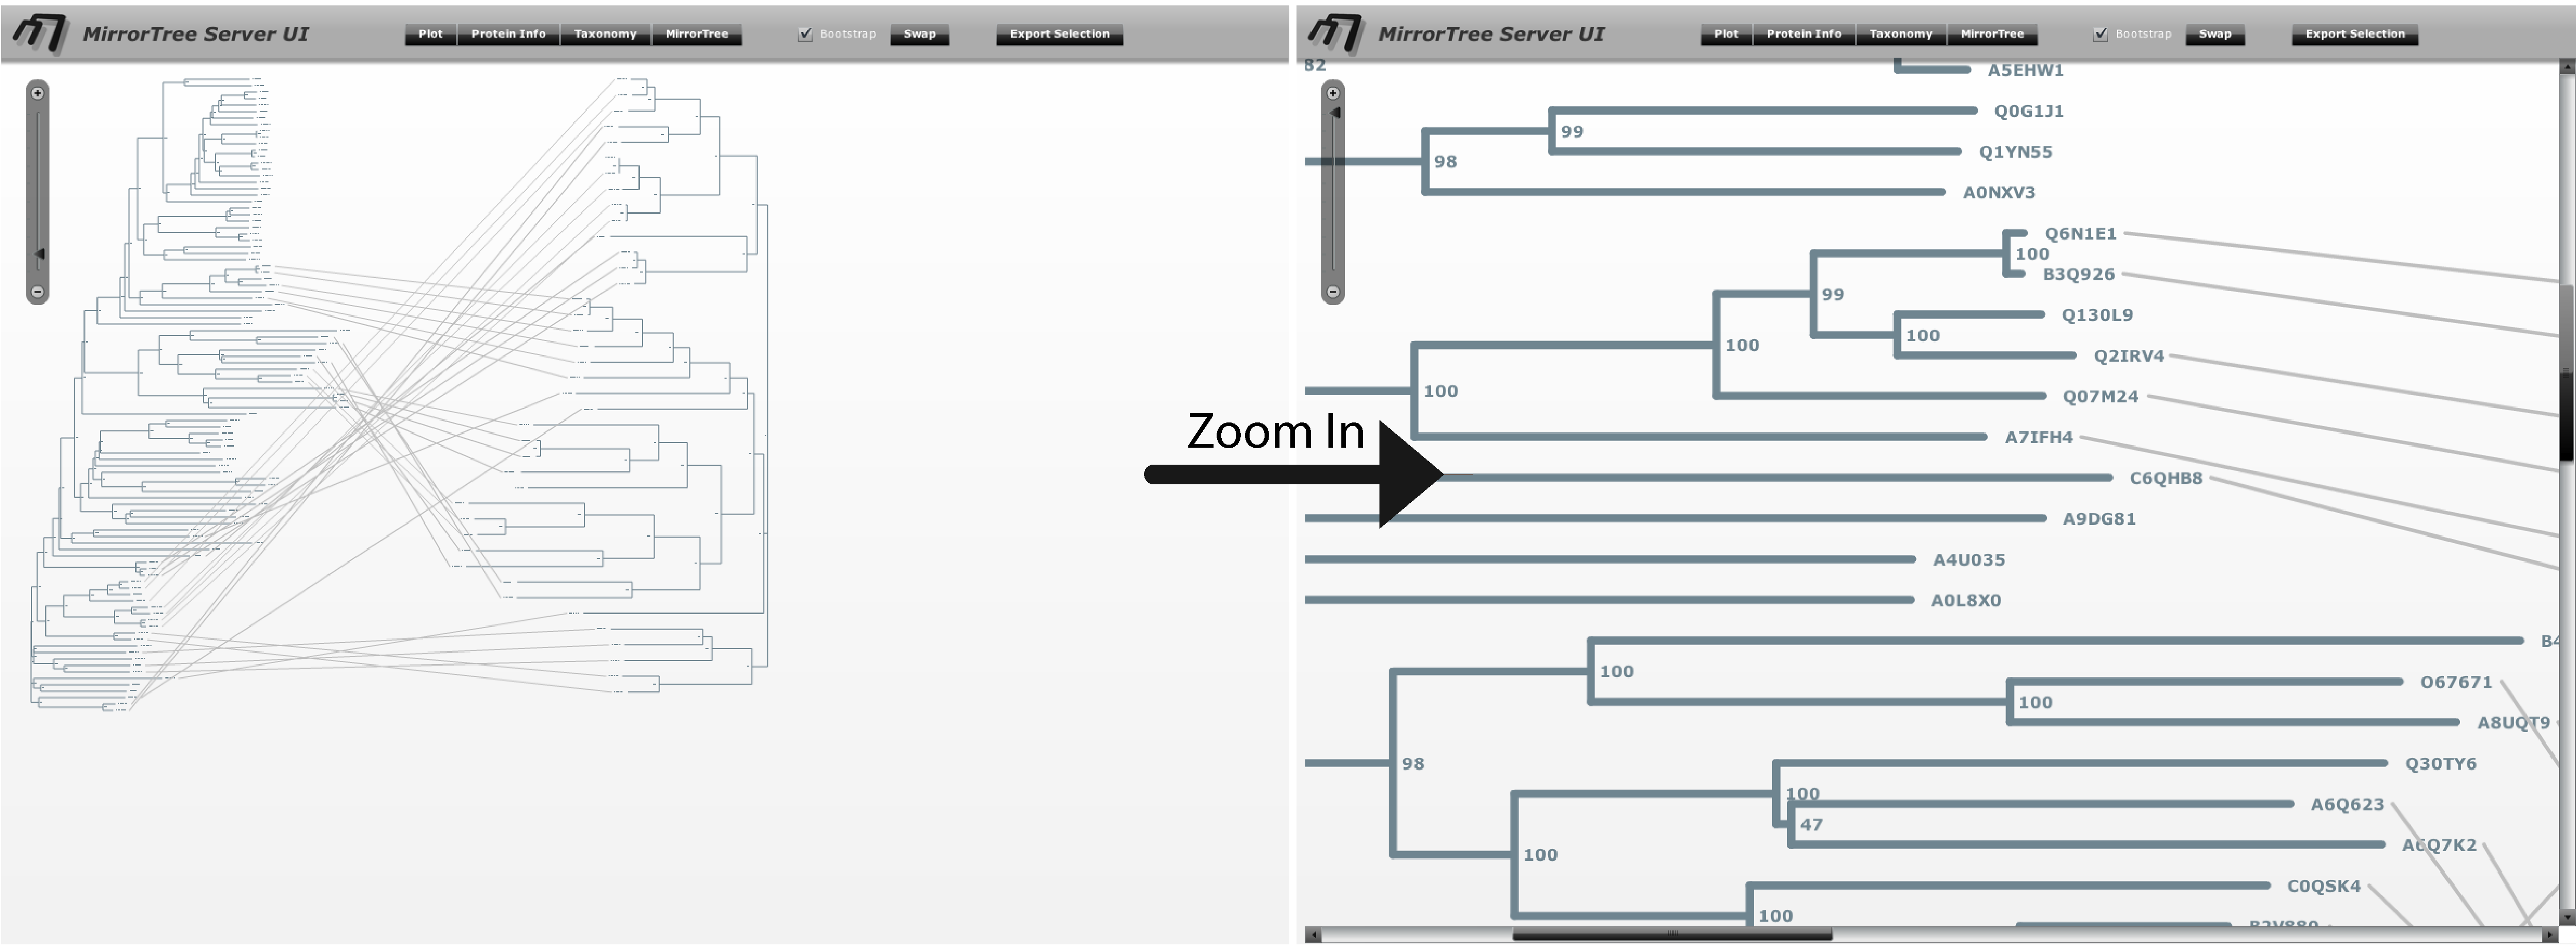
The main interface contains an interactive representation of the trees of the two families mirroring each other with common organisms linked by lines, and floating panels with different tools and information (Figure 3). These panels can be shown/hidden with the buttons in the top bar of the main interface ("Plot", "Protein info",...). We press these buttons (or press the "x" button in each panel's control bar) to hide the panels and have a clearer view of the mirroring trees. We observe that the right family, SoxA, is present in a smaller number of organisms than SoxB. We can zoom-in this representation with the scale on the top-left corner of the interface and move through it with the scroll bars in order to see the details (Figure 4).
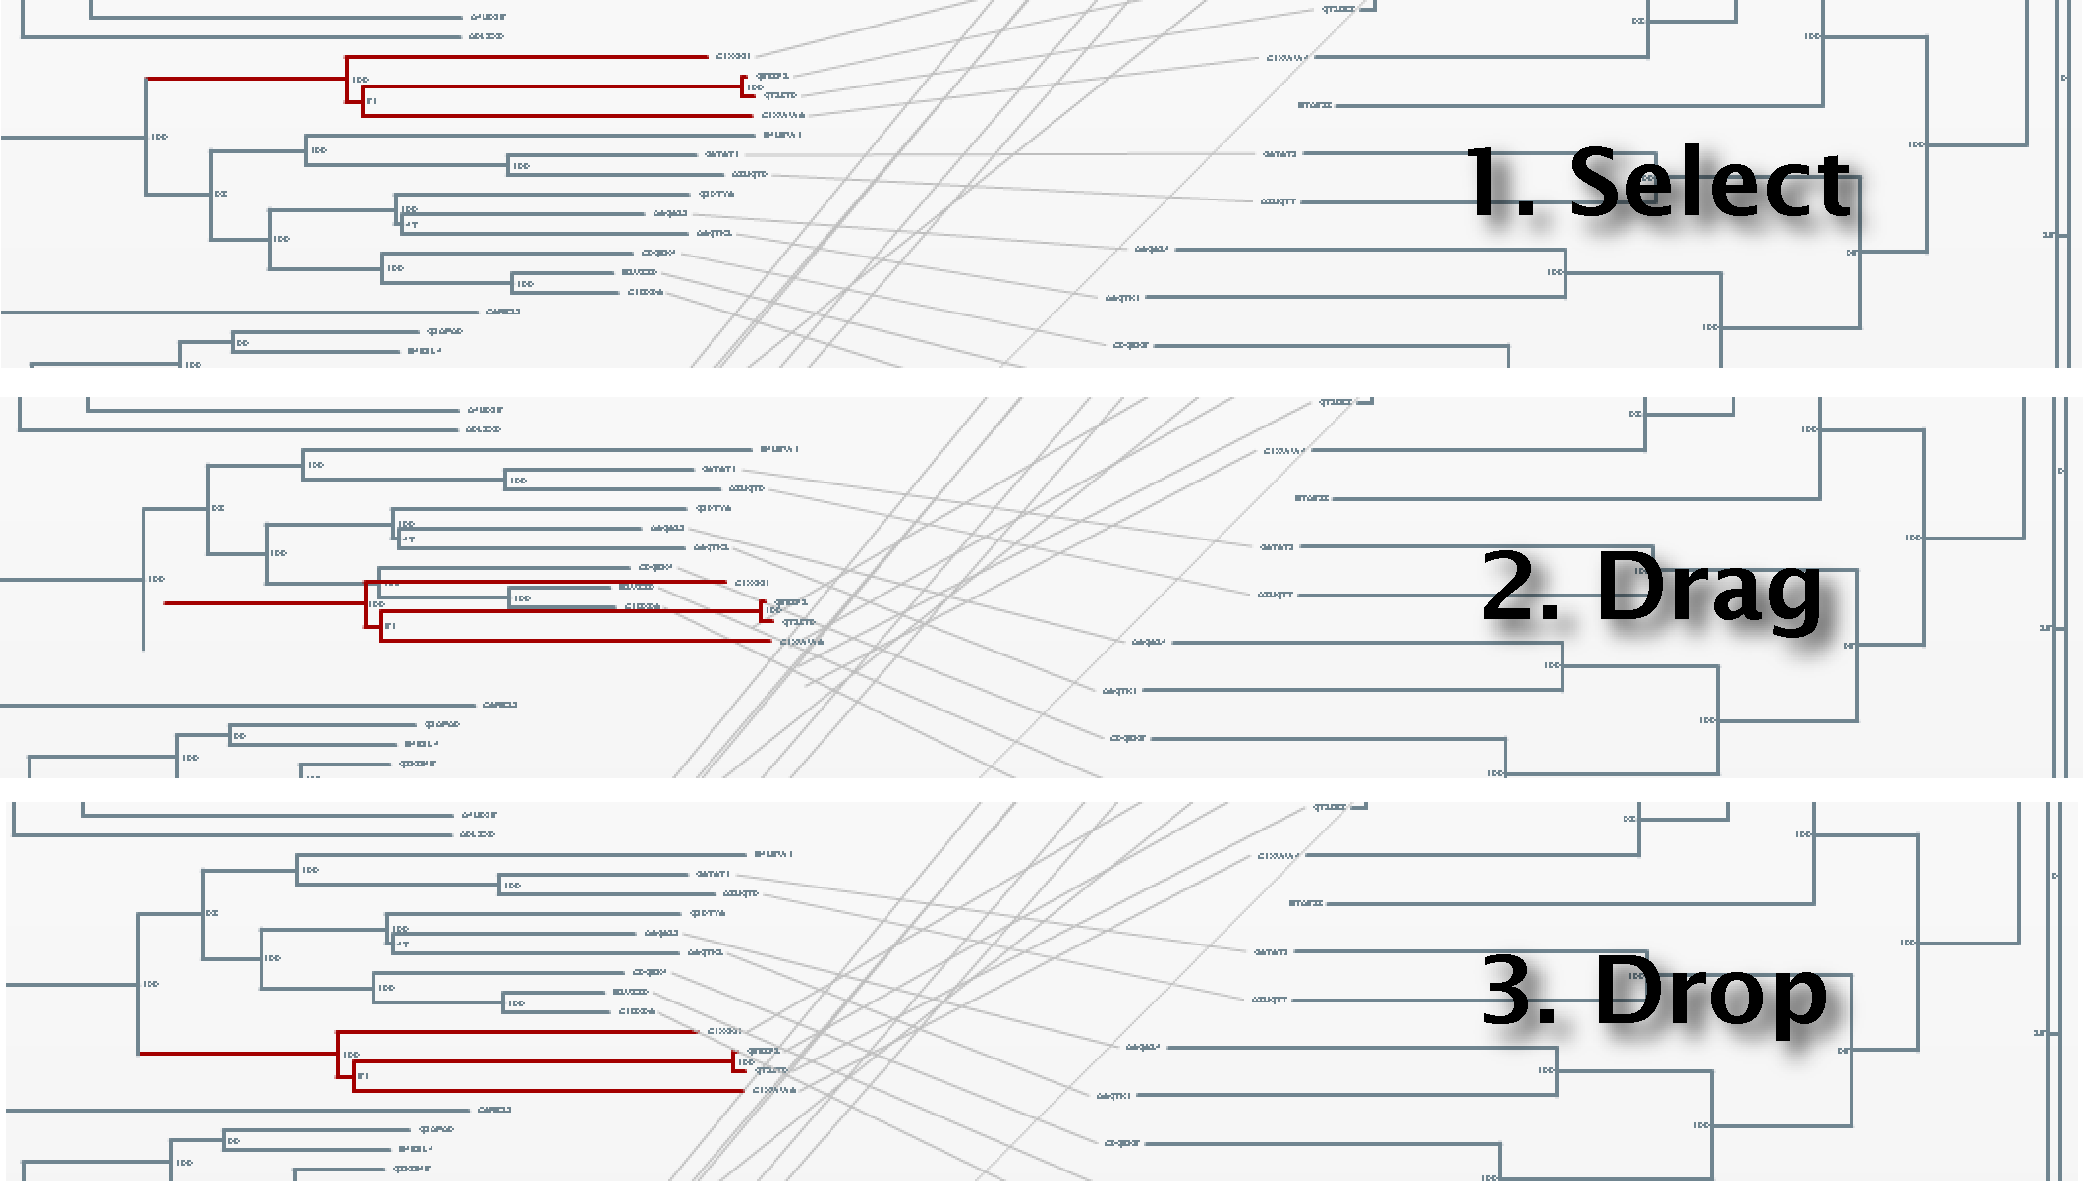
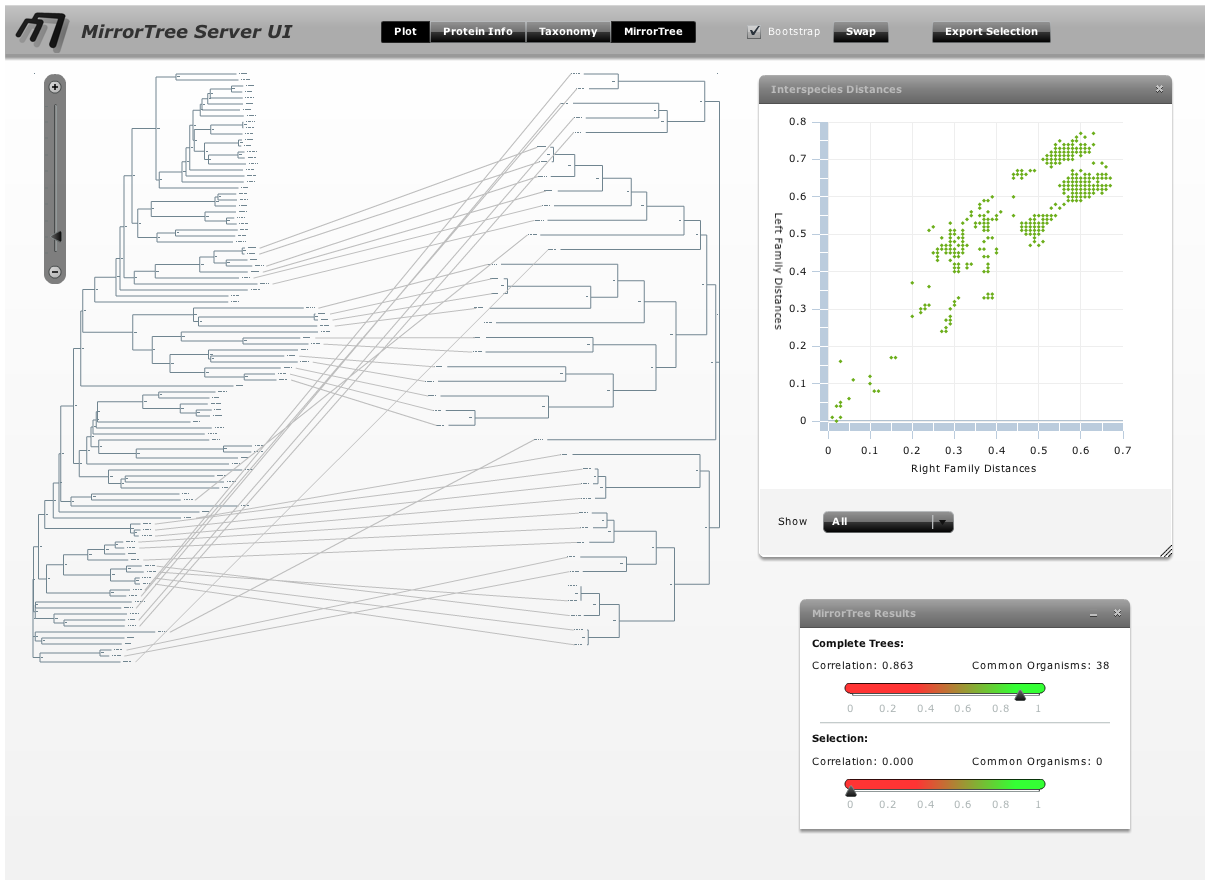
To obtain a better representation of the matching clades between the two trees avoiding, to some extent, the bundles of lines crossing each other, we change the layouts of the trees by swapping the positions of some branches. To swap the position of a branch with that of its sister we simply drag one on top of the other. It can also be done by selecting this node and pressing the swap button in the top bar. With these operations, we obtain a representation where the matching clades between the two trees are clearer (Figure 5). Now, to have an idea of the overall co-evolution between these two families, we activate the "Plot" and "Mirrortree" panels and we move them to a position in the screen where they do not interfere too much with the trees (Figure 6). We can see that these two families are clearly co-evolving . Their inter-organism distances are similar (Plot) which is reflected in a mirrortree score of 0.863.
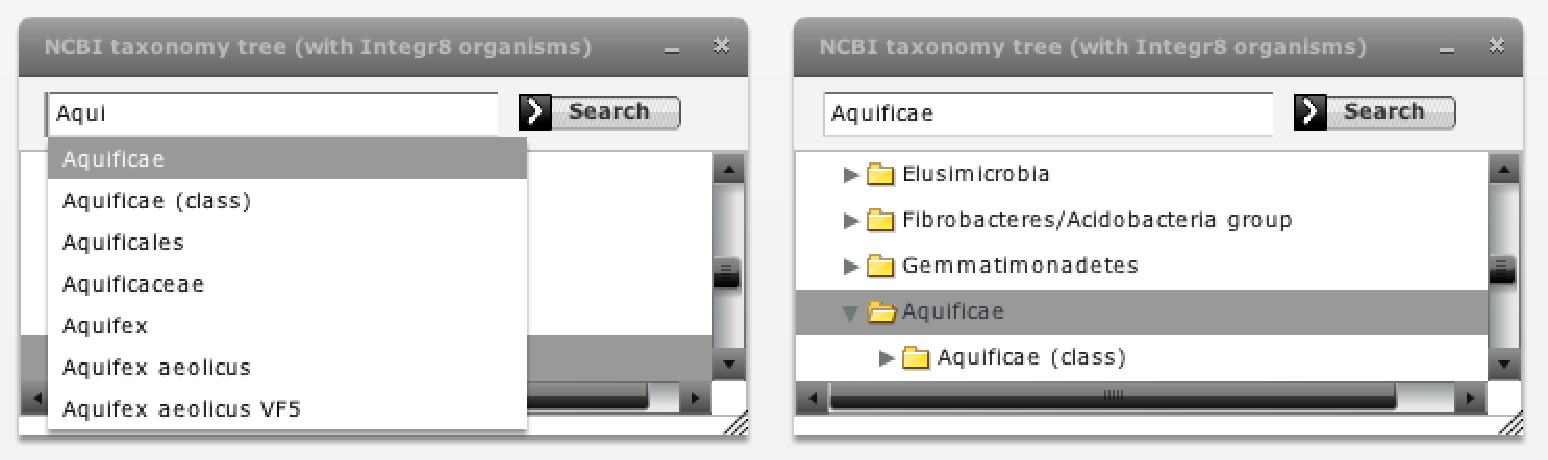
Now we activate the "taxonomy browser" to investigate in which phylogenetic groups these families are present and in which ones they are co-evolving more or less strongly. If we select the Bacteria kingdom in this browser (Figure 8), we realize that most organisms are selected in the trees (all but 1 and 4 species in SoxA and B respectively). We them expand the Bacteria node of the taxonomic tree by clicking the arrow on its left-hand side and successively select different bacterial subdivisions. Since selection is accumulative, remember to de-select the previous selection by clicking in an empty region in the tree representation. We can see that most organisms where these two genes are present belong to Proteobacteria, and a few to other 3 bacterial subdivisions. For each selected taxonomic group, we evaluate the co-evolution between these two families in that group in the "selection" part of the "Mirrortree" panel and with the "show -> selected nodes" option of the "Plot" panel (Figure 8). If we are interested in a particular group, such as the Aquificae taxa commented in Gosh et al., we can use the search box of the taxonomy browser to locate and select it (Figure 7).
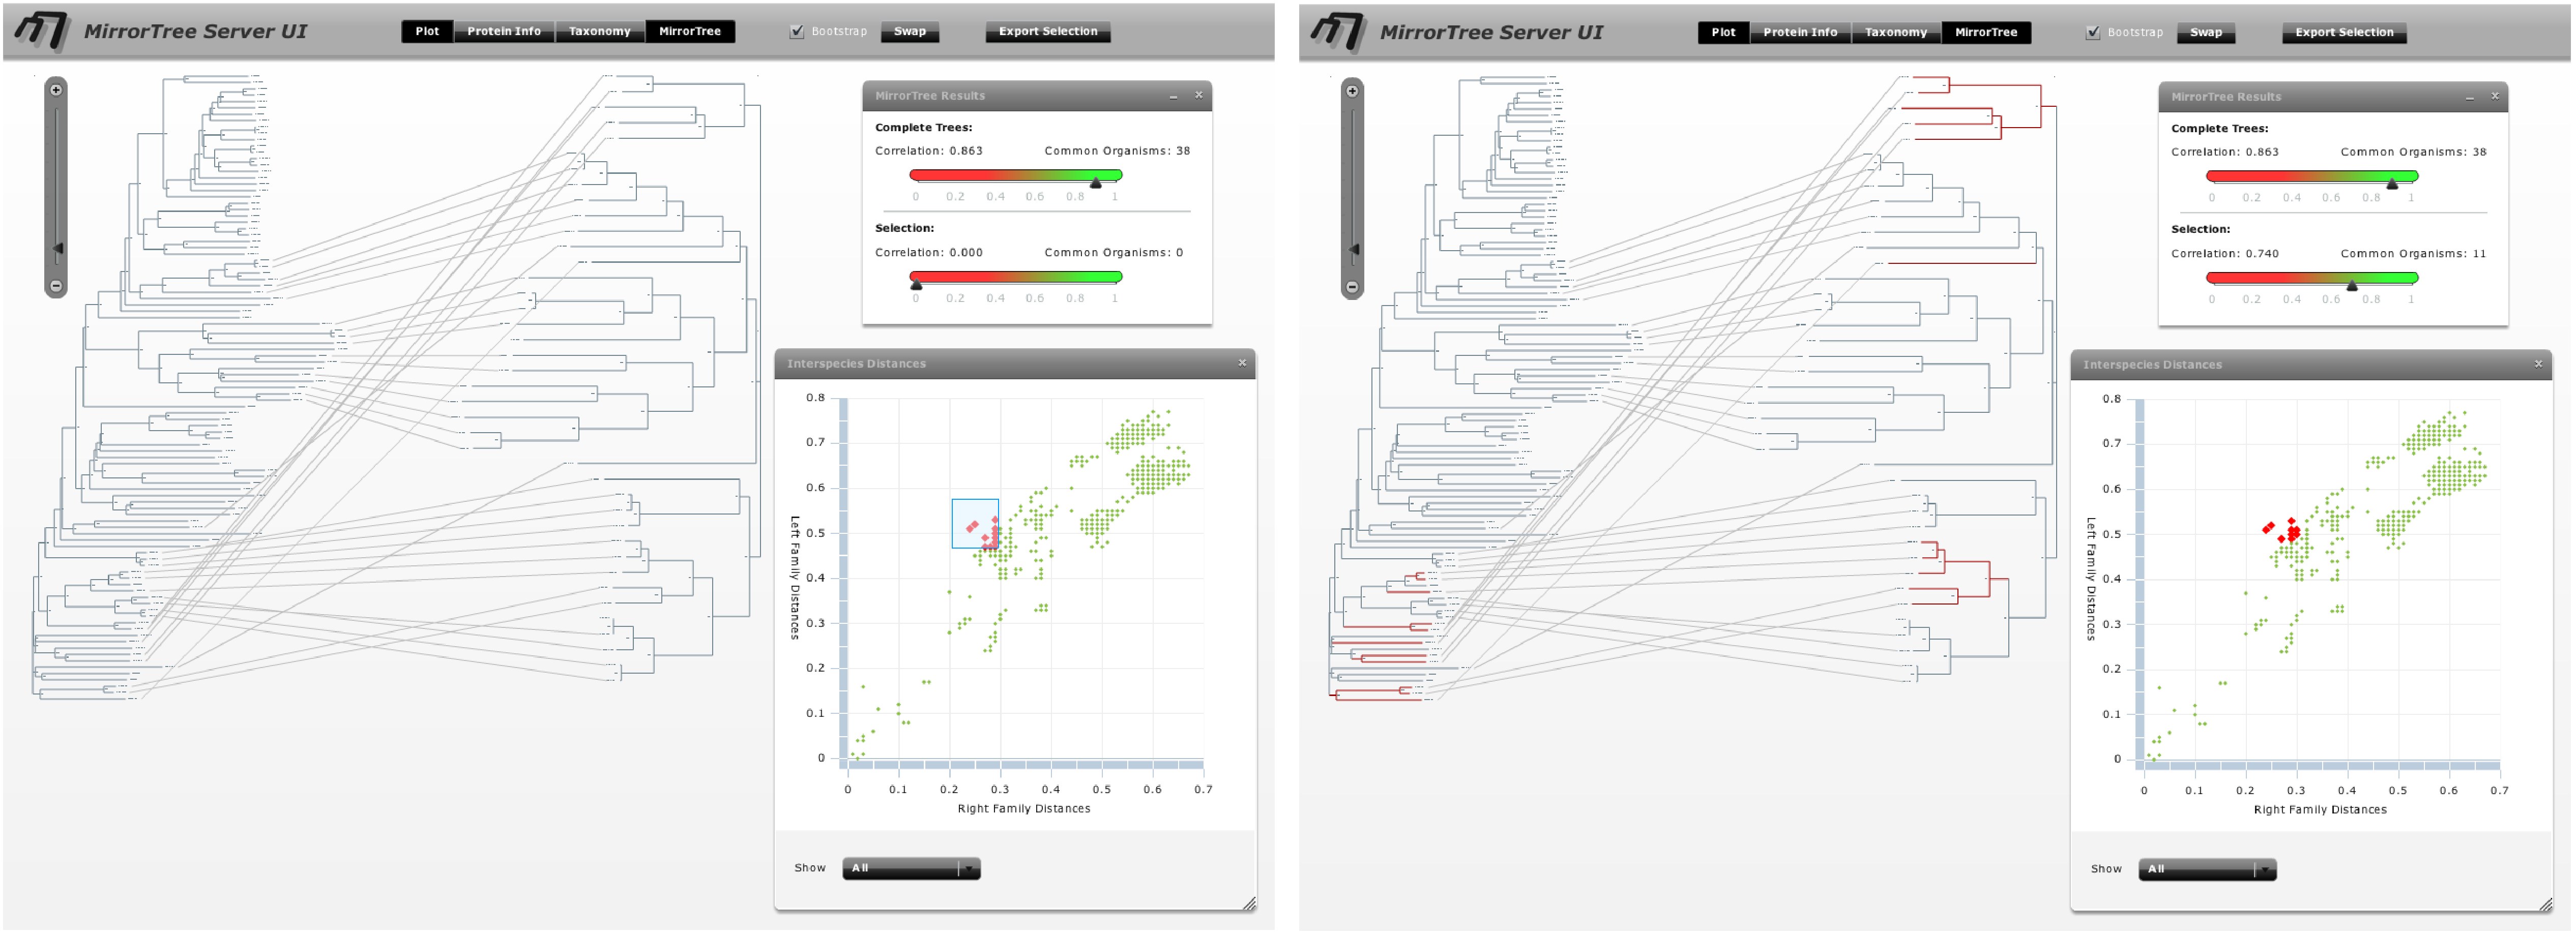
Evaluating the co-evolution in different taxonomic groups as commented above we realize SoxA and SoxB are strongly co-evolving in alpha-proteobacteria (0.988), gamma/epsilon-proteobacteria (0.994) and Aquificae (0.987). On the contrary, this co-evolution is not so evident in beta-proteobacteria (0.818). It is important to interpret these values always in a comparative way, between them and with the one obtained for all organisms (0.863). Additionally, if we select the distance points which deviate more from the overall co-evolutionary trend we realize that they mostly correspond to beta-proteobacteria (Figure 9).
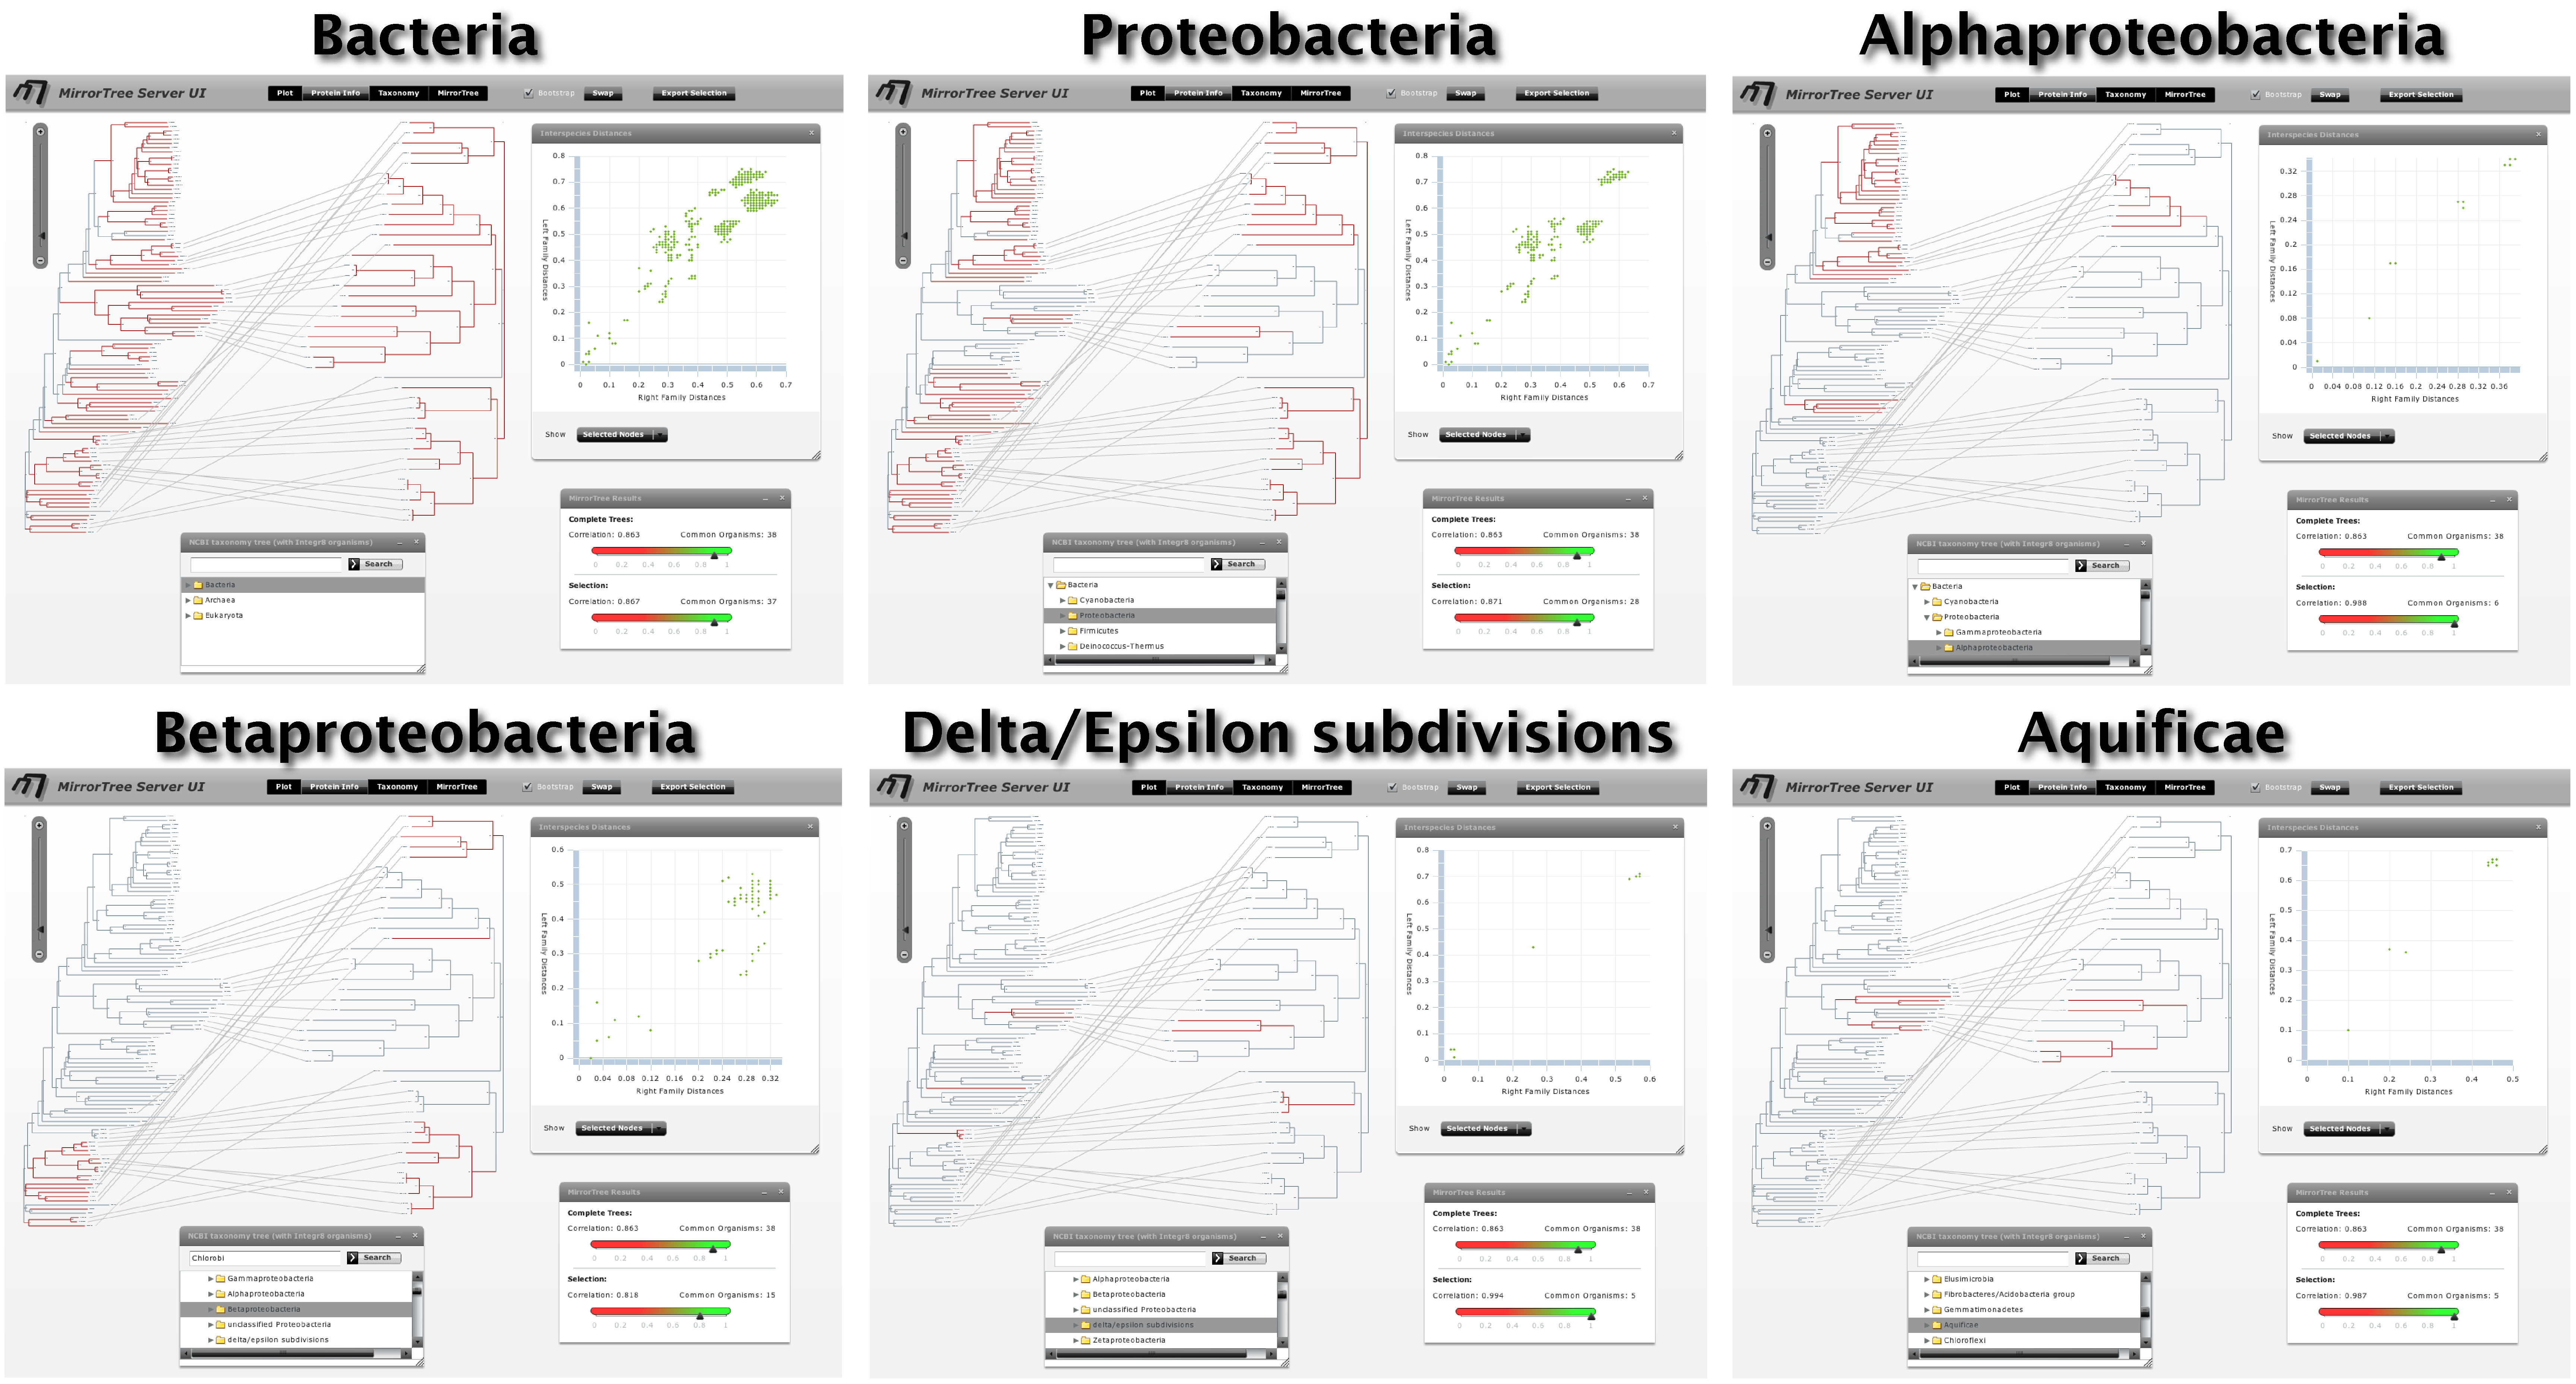
These results are in agreement with those obtained by Gosh et al. via a manual procedure which involved semi-automatic generation of phylogenetic trees and qualitative assessment of their similarities. These authors conclude that the Sox system is subject to a strong co-evolution which is essential for its functioning. They also reported that the co-evolution of many components of this system is more apparent in alpha and delta/epsilon proteobacteria, as well as in Aquificae; while beta-proteobacteria seem to deviate from such co-evolutionay trend. According with these authors, some of such phylogenetic disagreements could be due to horizontal gene transfer events (Gosh et al.).
We can now perform a deeper analysis on the sequences of the organisms where these families are tightly co-evolving (e.g. alpha proteobacteria). For that, we select that group in the taxonomy browser and then "Export" the corresponding aligned sequences (Figure 10). This alignment can be visualized with external software such as Jalview (Waterhouse et al) in order to look for conserved positions, etc. We could also select a group of organisms where these families are strongly co-evolving together with a group where they are not (e.g. alpha vs. beta proteobacteria) (remember that the selection is cumulative) and export the joint alignment of all these sequences in order to look for positions with a group-dependent conservation pattern trying to relate them with these different behaviours.
References
- Ghosh et al. Origin of the Sox multienzyme complex system in ancient thermophilic bacteria and coevolution of its constituent proteins. Res Microbiol (2009) vol. 160 (6) pp. 409-20
- Waterhouse et al. Jalview Version 2--a multiple sequence alignment editor and analysis workbench. Bioinformatics (2009) vol. 25 (9) pp. 1189-91