MirrorTree Server User Guide
The Mirrortree Server allows to graphically and interactively study the co-evolution of two protein families, and asses their interactions in an taxonomic context.
Input
The server accepts single sequences as input, although expert users can provide their own multiple sequence alignments or trees.
Sequences
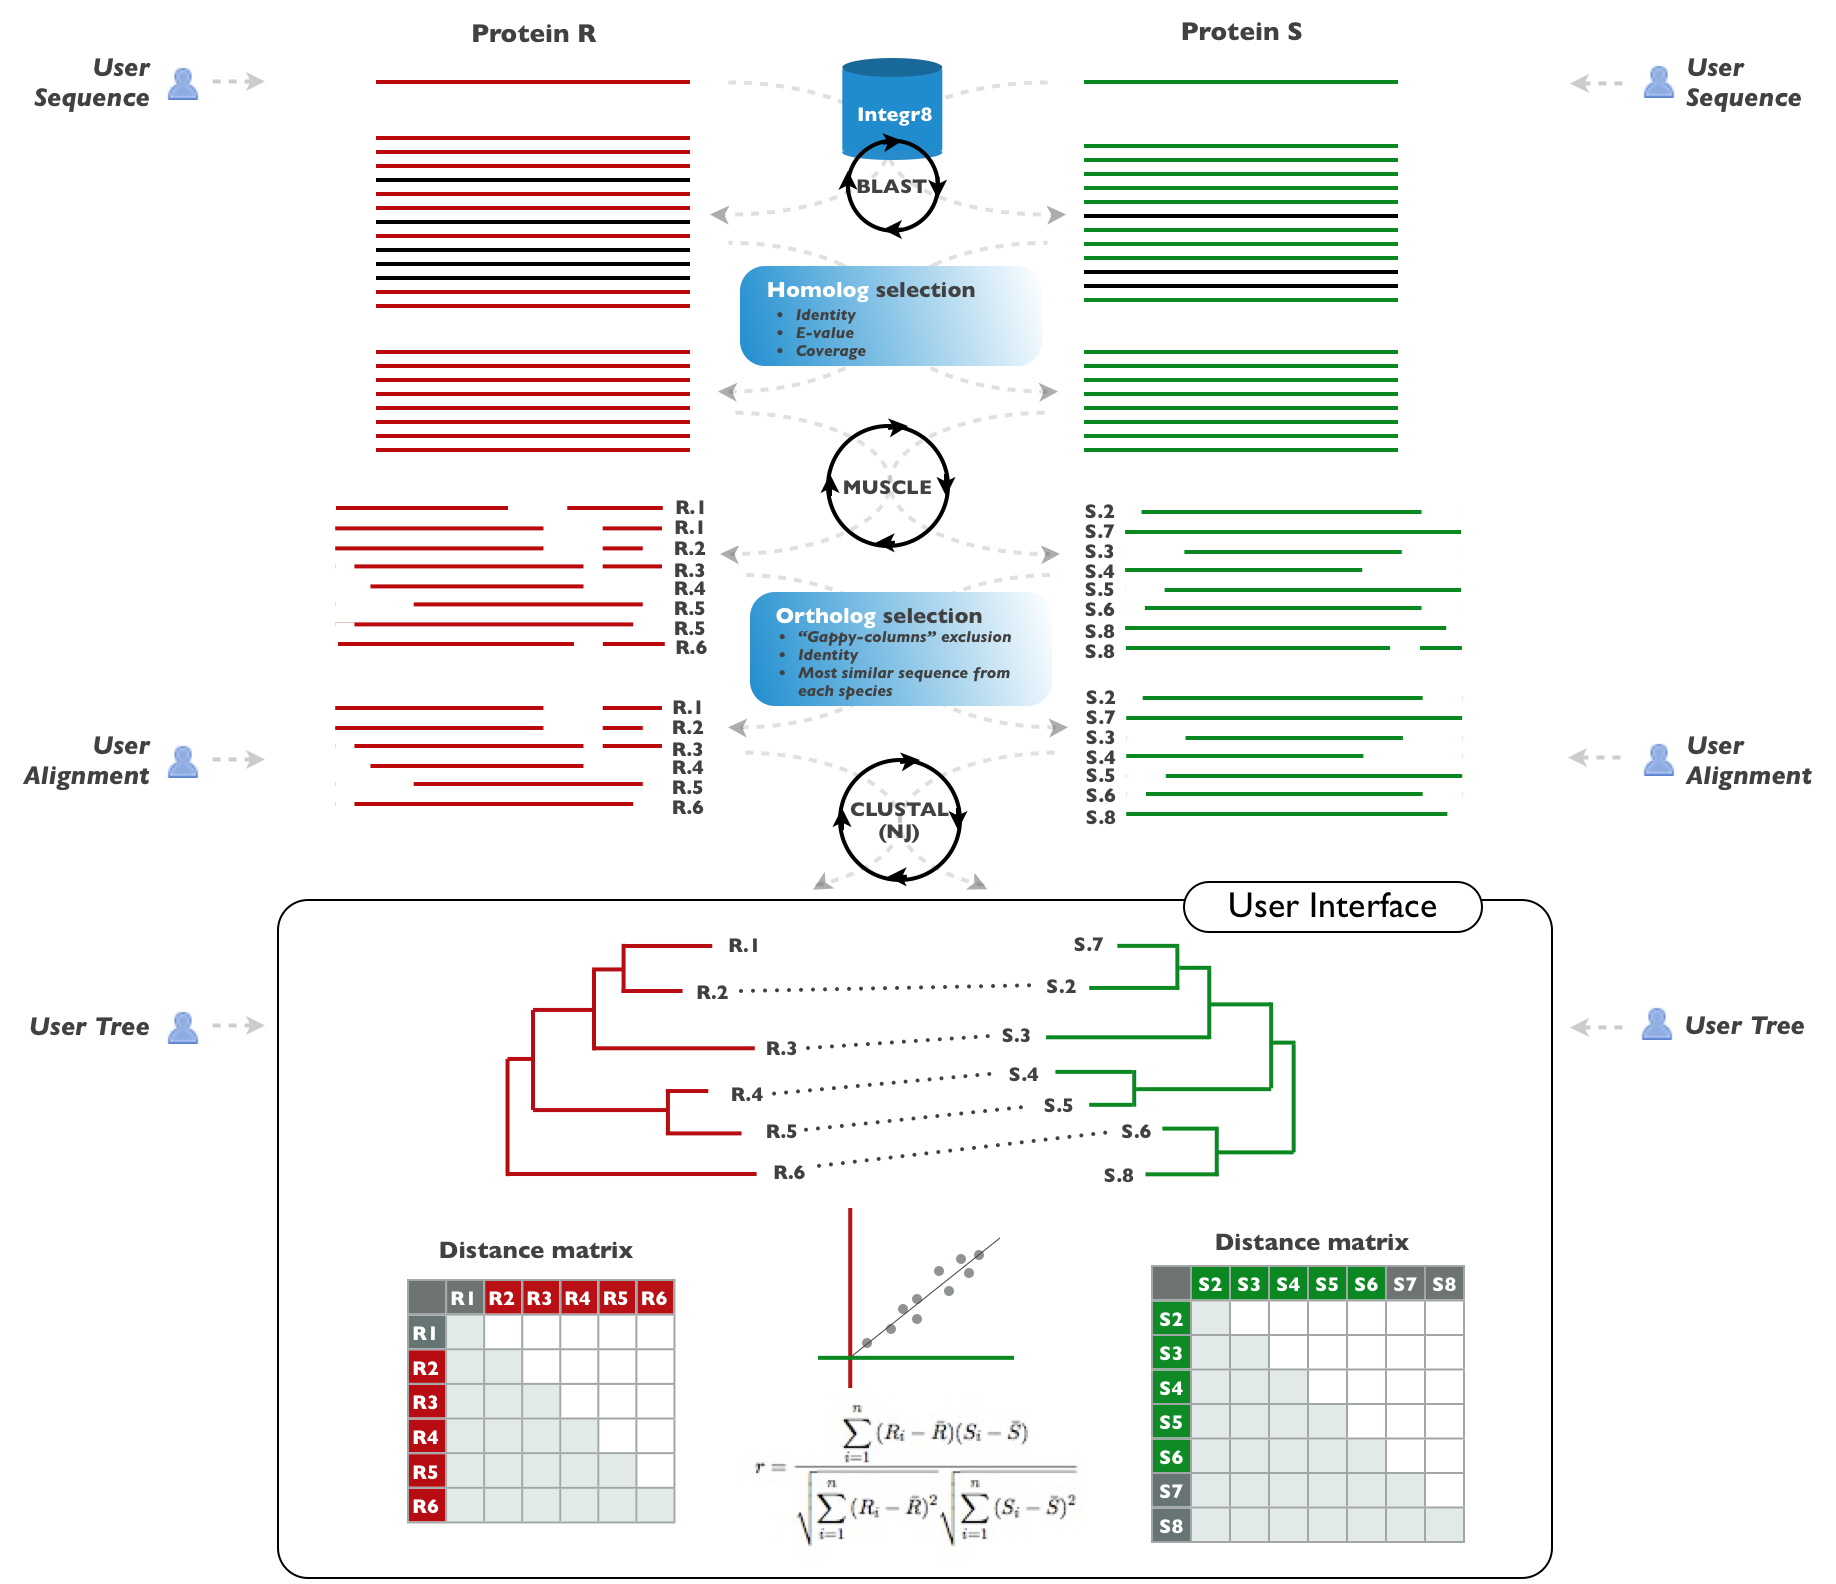
The user has to submit the sequence of a member of each one of the two families (in FASTA format (example)). This option is intended for non-expert users who want to rely on the server automatic procedure for generating the final phylogenetic trees. The system will look for orthologs in different species and generate the multiple sequence alignments and phylogenetic trees. The protocol implemented in the server is not intended to work with protein domains. You have to use whole-length sequences as input. For more information on the procedures used for generating alignments and trees see the publication and the system workflow.
Multiple sequence alignments
The user has to provide multiple sequence alignmets of ORTHOLOGS for the two families in "multiple fasta" format (example). ID's should be in a swissprot-like format ">XXX_YYY". If XXX and/or YYY are not valid Uniprot or NCBI TaxID identifiers the system will work but some features will be disabled (see Interface). Special care should be taken with the YYY part of the ID, which identifies the organism, since that label is used for matching the leaves between the two trees. Use only alphanumeric characters for this YYY part! This option is intended for advanced users who are able to look for orthologs for a given sequence and generate their own (curated) multiple sequence alignments with them. For example, the server implements a basic procedure for locating orthologs (see publication) since more sophisticated methods are infeasible in an automatic public server due to computational requirements.
Phylogenetic trees
Provide phylogenetic trees of ORTHOLOGS for the two families in "newick" format. Bootstrap values (or "0.0" if not available) (see FAQ below) should be indicated between squared brackets "[ ]" (see example). ID's should be in a swissprot-like format "XXX_YYY". See the “Multiple sequence alignments” section for more information on the ID's. Again, this option is intended for expert users who are able to generate good curated phylogenetic trees. Generation of good phylogenetic trees is a difficult and partially manual process that is highly beneficed from expert knowledge. This server implements a fast method for generating phylogenetic trees (“neighbour joining”) due to the infeasibility of including more sophisticated techniques such as parsimony or bayesian trees.
This information for the two families (sequences or alignments or trees) can be either copied/pasted in the textboxes or the files uploaded with the “select” button. The user can optionally provide a “job name”. An email address is required. To avoid server overload, each user (IP address) can submit a job each 10 min.
If the provided information is correct, the server will generate a page with the JobID and the URL where the results will be available. Take note of this JobID to include it when reporting any incidence with your query. You can access the URL with the results at any time: it will automatically reload each 30 seconds until the work finishes. Then, the page with the interactive visualization of the results will automatically appear (see next point). Additionally, you should receive an email with the same URL when the work is completed. It takes around 10 minutes to complete the process for two families with 120 organisms in common and an average length of 800 residues.
Interface

At the top of the page, you can find some intermediate results for the two families which might be useful, specially if you provided single sequences as input: blast results, multiple sequence alignments of orthologs, and the trees, in formats readable by other programs. Furthermore, you can find the advanced parameters used for homologs and orthologs selection.
The user interface requires Adobe Flash Player installed and configured in your web browser. Maximizing the browser window and a resolution of at least 1280x1024 is recommended.
The main window contains a menu bar, the display with the trees and several panels with tools to analyze them.
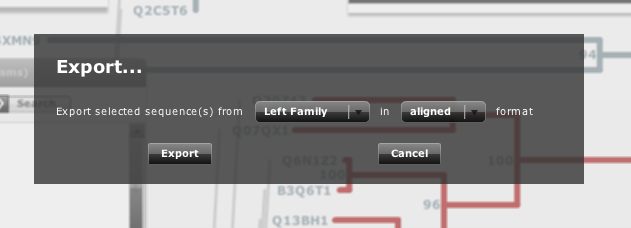
In the menu there are 4 buttons to show/hide the different panels (see below). You can also find a checkbox to show/hide the bootstrap values of the trees (see FAQ below) and a "export" button. This one allows you to export the selected sequences in one of the trees aligned or not (Figure 2). This tool is interesting if you want to use a subset of sequences or alignment for further studies.
There is also a button for entering the full-screen mode of the Flash panel in order to better use the interface. Note that, as in any other Flash program, this option makes the application to run slower.
Tree representation
In the main display you can find both trees facing each other with common organisms linked by lines. In the top-left corner you can find a slidebar to zoom in/out useful to go from global representations of the topologies to the most detailed information. By clicking a branch in a tree (line) the corresponding clade starting on it becomes selected. Selection is cumulative. To clear the selection (de-select) simply click outside a branch. We will go back to “branch selection” when explaining the rest of the panels below.
By clicking a particular protein (leaf in a tree) the “Protein Info” panel shows information available in Uniprot (Figure 1). This feature will not work if the user provides his/her own alignments or trees and the ID's of the sequences do not contain valid Uniprot identifiers.
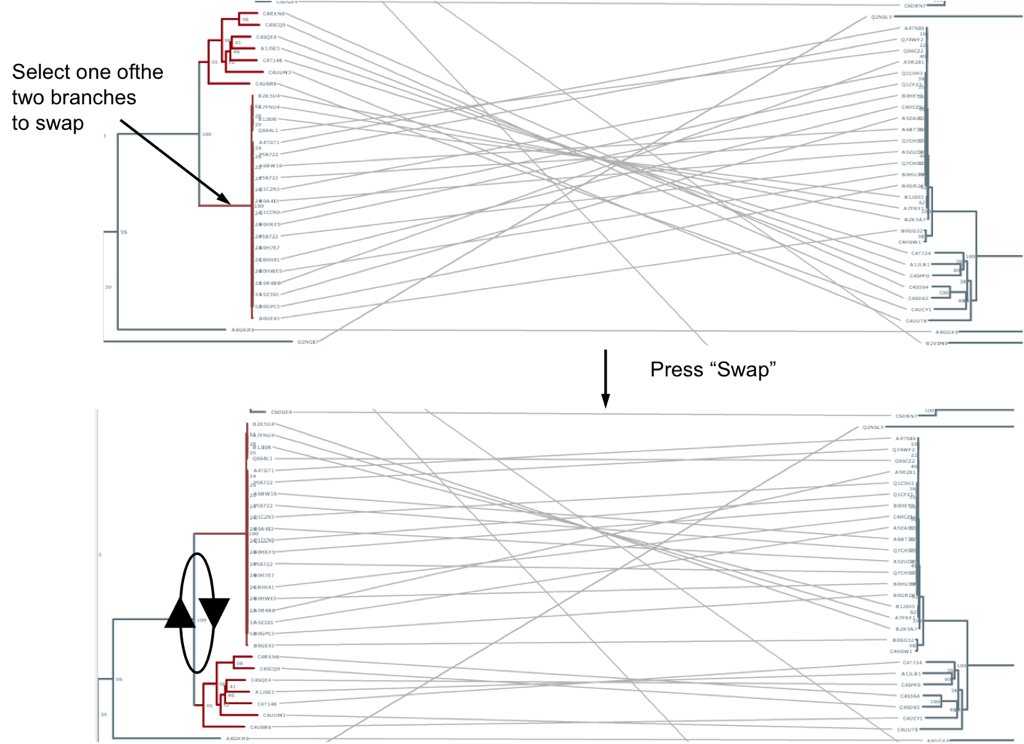
Sometimes the similarity between the two trees (or parts of them) is difficult to see because in that particular layout equivalent clades do not face each other. Automatically calculating the layout which maximizes the similarity is far from being trivial. With this interface, you can manually change the layout in some parts in order to improve the representation. You can do this by swapping the positions of the two “children” clades of nodes. For example, imagine two clades are topologically similar to their partners in the other tree, but they are in different layouts (up-down vs. down-up). For example, see the top panel in Figure 3 and note the two crossed bundles of lines linking the equivalent clades. To swap the positions of two branches simply select one of them and press “Swap”. It will be swapped with its sister branch. Swapping can also be done by dragging one branch into the other. (Note: to “de-select” simply click outside a branch -line-)
Panels
The different panels can be show/hide with the corresponding buttons. Once activated, they simulate a desktop with different windows which can be moved around. Double-clicking the window control bar leads to the corresponding section in this help file.
The “MirrorTree Results” panel shows the similarity between the two trees as calculated by mirrortree in a color scale, from red (low similarity) to green (high similarity), as well as the number of species in common (Figure 1) The calculation of similarity can be restricted to parts of the trees simply selecting these parts in the tree representation (see “selecting branches” above). As soon as the current selection includes clades of both trees with organisms in common, the tree similarity between these sub-trees is calculated and shown in the “Selection” part of the “MirrorTree Results” panel.
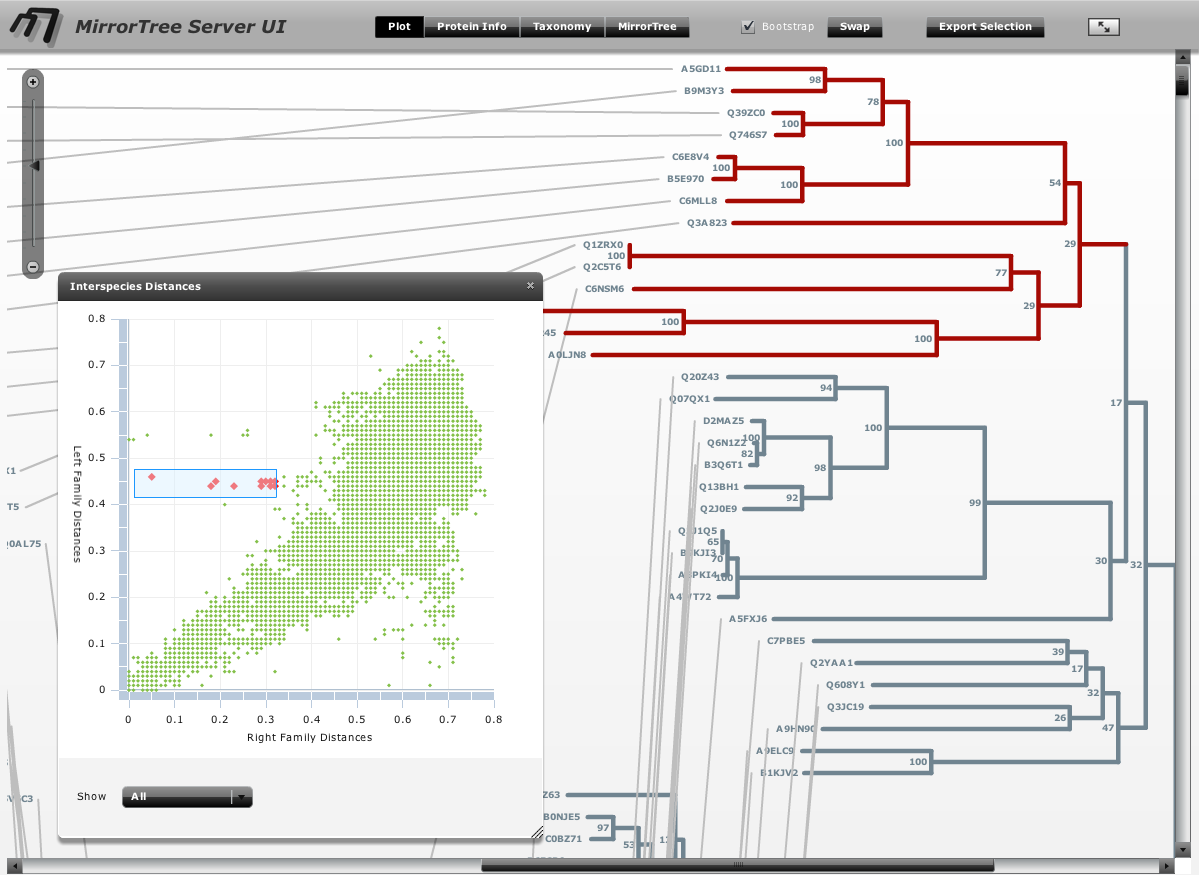
Selection can also be done by taxonomic criteria, in order to evaluate the tree similarity only for a given taxa, kingdom, etc. To do that, open the “taxonomy browser” panel, navigate the “NCBI taxonomy tree” (restricted to the Integr8 organisms) and select a group at any level in the taxonomy. You can also type the name of an organism of taxonomic group in the “search” text box to find it directly (Figure 1). The organisms in both trees belonging to that group become selected and the corresponding tree similarity for the selection is reported. This feature will not work if the user provides his/her own alignments or trees (see the Input section) and the ID's of the sequences do not contain valid NCBI TaxIDs or these are not in the Integr8 database.
The “Interespecies Plot” panel (Figure 4) contains a simplified representation of the correlation between the inter-protein distances in both trees. Each dot in the plot represent the distance between a pair of species in both trees. That is the base for calculating the mirrortree score (see Pazos & Valencia (2001). Protein Eng. 14(9):609-614). The plot can show the whole set of distances or only the ones corresponding to the current selection (“Show” button below). This plot is useful for detecting parts of the trees not following the similarity trend represented by its diagonal. These outliers can be due to non standard evolutionary events such as horizontal gene transfers (see Pazos et al. (2005). J Mol Biol. 352(4):1002-1015). Clouds of dots can be selected in this plot (e.g. outliers) and they are translated into selections of the corresponding organisms in the trees. This allows, for example, to locate the parts of the trees breaking the overall similarity trend.
Workflow
Click here to show the complete workflow
Tools & Databases
- Blast - Altschul et al. Basic local alignment search tool. J Mol Biol (1990) vol. 215 (3) pp. 403-410.
- Muscle - Edgar. MUSCLE: multiple sequence alignment with high accuracy and high throughput. Nucleic Acids Res (2004) vol. 32 (5) pp. 1792-1797
- ClustalW - Larkin et al. Clustal W and Clustal X version 2.0. Bioinformatics (2007) vol. 23 (21) pp. 2947-8
- Integr8 - Kersey et al. Integr8 and Genome Reviews: integrated views of complete genomes and proteomes. Nucleic Acids Res (2005) vol. 33 (Database issue) pp. D297-302
FAQ
What can I do if I don't receive the results?
You should send your JobID to the contact email shown above.
Can I submit protein domains?
The current implementation of the MirrorTree server is not designed for handling domains since they could be lost during the filtering steps. If you want to compare trees of individual domains you can use generate your own alignments or tress and submit them.
What are "bootstrap" values?
The short answer is that bootstrap values give an idea of the confidence of tree branches. They are calculated by introducing randomly small changes in the multiple sequence alignment used to generate the tree and assesing whether a given branch stands in these randomized trees. Stable branches are not affected by these minor modifications in the input data. In the trees automatically generated by this server, bootstrap values range from 0 (unstable branch) to 100 (very stable branch).
Citation
Please cite the following article when reporting any result, data or figure obtained with this server.
- David Ochoa and Florencio Pazos. Studying the co-evolution of protein families with the Mirrortree web server. Bioinformatics (2010) vol. 26 (10) pp. 1370-1
Additional Resources
- Command line versions of Mirrotee, and related programs and material here.
- TSEMA/TAG_TSEMA systems for predicting the mapping (links between the individual proteins) between two families of proteins known to interact.
