MBROLE 3
Metabolites Biological Role
User manual
Input
To perform overrepresentation analysis of metabolite annotations with MBROLE, you have to:
- Provide a set of compounds.
- Select the annotations (vocabularies) you want to analyze.
- Provide a background set.
You can test the server right away with a provided example by clicking the Load example button at the Analysis section.
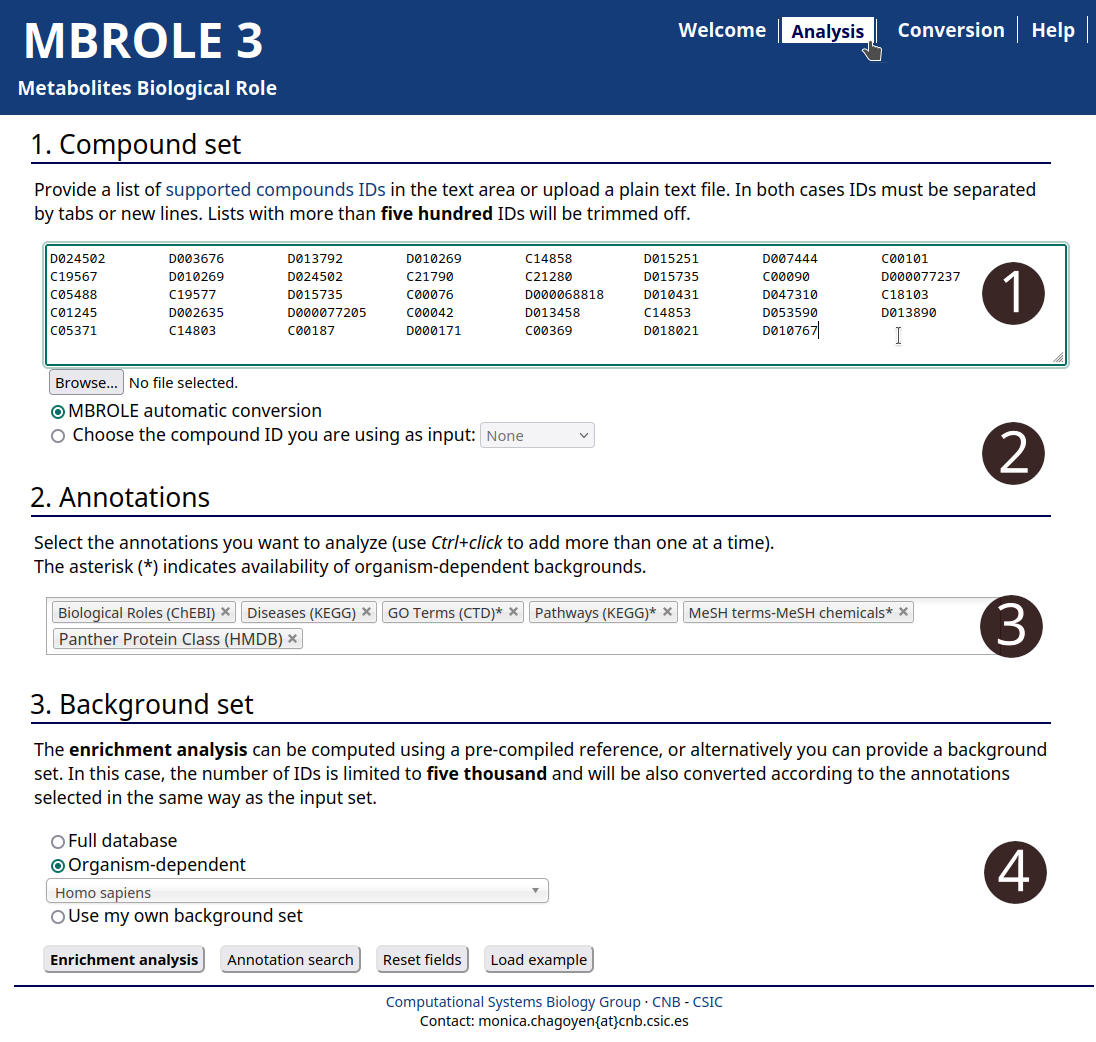
1. Compound set
The compound set is a list of compounds you are interested in (e.g. a set of metabolites identified in your experiment). Either you can copy/paste a list of IDs, or upload a file (MBROLE expects tabs or new lines as ID separators).
See the Conversion section for further information on supported IDs.
2. Annotations
Annotations are organized into several vocabularies extracted from metabolic and chemical databases. Select the vocabulary (or vocabularies) you want to use for the enrichment analysis. You can include multiple annotations at once by clicking on them while pressing Ctrl button. You can also use the box for searching annotations. Annotations already selected will appear in lighter color in the menu. To remove an annotation or vocabulary from the list press in the "x" besides it.
The vocabularies included in this version of MBROLE are the following:
- Pathways
- Pathways: from BioCyc, HMDB, KEGG, PathBank, Reactome, PharmGKB and YMDB.
- Modules: from KEGG.
- Pathway Classes: from Reactome.
- Interactions
- Protein interactions: from BioCyc, HMDB and PathBank.
- Roles
- Biological Roles: from ChEBI and KEGG.
- Role and Physiological effect: from HMDB ontology.
- Gene Ontology Terms: from CTD.
- Locations
- Tissue: from HMDB (e.g. Bladder or Bone Marrow).
- Biofluid: from HMDB (e.g. Blood or Urine).
- Cellular: from YMDB, ECMDB and HMDB.
- Disposition from the HMDB ontology.
- Drugs
- Indications from TTD (e.g. Hypoglycemia or Gastritis).
- Pharmacological actions from MeSH (e.g. Antiviral Agents).
- Anatomical Therapeutic Chemical Classification (ATC) from KEGG.
- Diseases
- Disease Classification from KEGG (e.g. Skin diseases or Parasitic infections).
- Diseases from HMDB and KEGG.
- Chemical classification
- Chemical Taxonomy: from LMSD and HMDB.
- MeSH hierarchy.
- Chemical types from BioCyc.
- Indirect Annotations
- Uniprot Keywords and Panther Protein Class from chemical-protein interactions (BioCyc, HMDB, and PathBank).
- MeSH terms from co-citations in PubMed with HMDB compounds and MeSH chemicals.
3. Background set
MBROLE needs a background set of compounds to compute statistics. This background set is a reference used for assessing the significance of a given annotation to be enriched in your compounds of interest.
A given annotation could have a high frequency in your set of compounds simply because it is frequent in the whole metabolome. This is why a reference set is needed for assessing significance. This background set should contain all the compounds that could hypothetically be identified in your experiment (in a global profiling experiment, the background set will correspond to the whole metabolome).
Therefore, you can choose which type of background set is better depending on your data and/or the information you want to obtain:
- Full database: MBROLE will use as background all the compounds in the database(s) associated with the selected annotations.
- Organism-dependent: MBROLE will use the compounds associated to the selected organism as background set. Organism-specific annotations are marked with an asterisk (*). Note that if you select annotations of an organism-specific database different than the selected organism, those annotations won't be considered (e.g. Diseases from HMDB and Mus musculus as background organism). For the rest of annotations, the background will be all the compounds in the corresponding database.
- Use my own background set: paste a list or upload a file with the IDs you want to use as background. Note that this option will take significantly more time that the others as every ID need to be checked whether exists in the database. Also, only supported compound IDS are valid inputs.
Once the fields in the input form are completed, press the Enrichment analysis button. If an error is found in the input, a red text box shows up at the top describing it.
Results
In this new version, results are separated in two different categories. These categories are the same used to organize the vocabularies in the Annotations section of the analysis page. A new navigation bar allows you to change between the results obtained from (Direct and Indirect) annotations. Each of these sections includes a single table which can be sorted by clicking on its headers. By default, these tables are sorted by decreasing significance (increasing FDR). Each annotation (keyword) will be arranged in a row with several columns containing all the information:
- Annotation shows the annotation (keyword) itself and, if available, a link to its entry in the source database.
- Category shows to which vocabulary the keyword belongs (take a look at the classification of annotation vocabularies in the Annotations section of the user manual).
- Set shows the number of compounds in your input that have annotations in that category.
- In set shows the number of your compounds that have this particular annotation.
- Background shows the total number of compounds with annotations in that category.
- In background shows the number of compounds from the background with this particular annotation.
- p-value of the enrichment analysis test for that annotation. It is calculated using the values from Set, In set, Background, and In background.
- FDR shows the adjusted p-value calculated as False Discovery Rate (FDR).
- Submitted IDs Shows those IDs from your set with that particular annotation (keyword).
- Matching IDs Shows the equivalent IDs from your set that actually matched the particular annotation. For example, if you provided KEGG IDs and selected Pathways from HMDB as vocabulary, this column will show the equivalent IDs from HMDB involved in the corresponding pathways.
The following two columns show up if you select "Show compounds in results table" at the top of the page.
MBROLE computes the statistical significance of each annotation found using the background set. This is provided as a p-value, or the probability of obtaining such a number (or more) of those compounds with a particular annotation in case we take a random set of the same size from the background set.
This p-value is also adjusted for multiple testing using the false discovery rate (FDR) method by Benjamini and Hochberg (1995)*. Both, p-value and adjusted p-value are reported for each annotation and, when possible, annotations and compound IDs are hyperlinked to their corresponding source database.
For KEGG pathways, the compounds in the input set are highlighted in the pathway representation generated by the hyperlink. P-values are colored based on their significance level, (green for values <0.001; red for values ≥0.05 and orange for the rest). Put the mouse over each "Category" cell and it'll show the number of metabolites used as background as well as the number of associated metabolites found in it. You can see an example of this in Fig.2 of the Tutorial
For practical purposes, MBROLE only shows those annotations found in three or more metabolites of the input set.
In case your query does not return any significant result and/or you are interested in those annotations filtered out, you can download the whole set of results clicking on the ("Download all annotations" button). The file generated is a TSV plain text file ready for being further processed with any spreadsheet program .
Generation of plots
Another novelty in this version of MBROLE is the generation of plots of the results. You can generate dot plots and bar plots by clicking on their corresponding buttons. Doing so will display in a new tab one figure for every vocabulary selected showing the most significant annotations (FDR < 0.05). The number of annotations in each plot is limited to twenty and it is indicated in the title of the plot. In the event that no significant annotations are found for a vocabulary, its plot won't be generated.
Both types of plots show the False Discovery Rate of each annotation with a color code illustrating its enrichment ratio. In the the dot plots, the size of the dot correlates with the number of compounds from the input set matching the annotation.
The enrichment ratio is calculated as the number of compounds with a given annotation against the expected value, where the expected value is the product of the input compounds found in a vocabulary and the ratio of those compounds in the background set.
Conversion
Analysis section
You can now choose among two different types of ID conversion when running an analysis:
- Direct conversion (option selected by default): searches for equivalent IDs when the source database of the annotation selected provides corresponding cross-references. When this option is selected, you will need to indicate the type of ID and the list of annotations will be updated disabling those whose source databases do not include such cross-reference.
- Automatic conversion: allows mixing IDs from different sources. If the source database of the annotations selected does not include cross-references of the input IDs, a subsequent search will look for an intermediate chemical ID that relates the input ID and the IDs used for the corresponding annotation.
Conversion tool
MBROLE includes an independent conversion utility that implements the Direct Conversion described before. This utility also accepts chemical names as input for converting them to any of the supported IDs, and it is accessible via the "Conversion" link at the top of MBROLE pages.
Supported IDs
- BioCyc compounds (e.g. CPLX3O-77 for phosphofructokinase).
- CAS Registry Number (e.g. 26566-61-0 for galactose)
- ChEBI accessions (e.g. CHEBI:34590 for bromobutide).
- ChemSpider IDs (e.g. 733 for glycerin)
- ECMDB metabolites (e.g. ECMDB00039 for butyric acid).
- HMDB metabolites (e.g. HMDB0000064 for creatine).
- KEGG (e.g. C00008 for ADP).
- LIPID MAPS® Structure Database IDs (e.g. LMST01010001 for cholesterol)
- MeSH chemicals (e.g. D005947 for glucose)
- PubChem Compounds (e.g. 5793 for glucose)
- TTD (e.g. D0J7XL for Gramicidin D).
- YMDB metabolites (e.g. YMDB00003 for urea).
Annotations
Current annotations available in MBROLE, classified according with the database they were obtained from:
- Human Metabolome Database (HMDB) metabolites
- HMDB ontology Hierarchycal vocabulary divided in four general categories: Disposition, Physiological effect, Process and Role.
- Diseases e.g. Obesity, Kidney disease, or Pyruvate dehydrogenase deficiency.
- Localization in biofluid (e.g. Blood, Urine), tissue (e.g. Bladder, Bone Marrow, Neuron) or cellular (e.g. Extracellular, Membrane, Mitochondria).
- Chemical Classification: Hierarchical classification of chemical entities.
- Diseases.
- Pathways: information on biological networks from the Small Molecule Pathway Database.
- Protein interactions for UniProt.
- Uniprot Keywords.
- Panther Protein Classes: via Uniprot interactions.
- Co-citations of chemicals: Terms from the literature frequently mentioned together with chemicals.
- ChEBI accessions (only 3star compounds)
- Biological role: played by the compound or part thereof in three different contexts: biological (e.g. toxin, immunomodulator, antimicrobial agent), chemical (e.g. antioxidant, surfactant, acceptor) and application (e.g. agrochemical, pesticide, dye).
- BioCyc compounds
- Pathways related to the metabolite and its possition in the biological network.
- Chemical Classification.
- Protein interaction for Uniprot.
- Uniprot Keywords.
- MeSH chemicals
- Pharmacological actions: a broad range of chemical actions and uses (e.g. Luminescent, Antineoplastic or Bronchodilator).
- MeSH hierarchy: categorical classification of chemicals (D03 for Heterocyclic Compounds or D03.438.221 for Benzoxazoles).
- Co-citations of chemicals: Terms from the literature frequently mentioned together with chemicals.
- Yeast Metabolome Database (YMDB) metabolites
- Location: subcellular locations (e.g. extracellular, cytoplasm, nucleus).
- Pathways from SMPDB related to metabolites.
- Kyoto Encyclopedia of Genes and Genomes (KEGG)
- Pathways: information on biological networks, mainly related to metabolism, such as galactose metabolism.
- Modules: (Glycolysis, Ubiquitin system or Sterol metabolism).
- Biological role: as described in the BRITE hierarchy, e.g. carbohydrates, cofactors, hormones...
- Drug classification, e.g. antiinfectives or Antiepileptics.
- Drug classification according to the Anatomical Therapeutical Classification.
- Modules: a collection of manually defined functional units (Glycolysis, Ubiquitin system or Sterol metabolism).
- Diseases.
- Disease Classification ICD-11 Classification of diseases.
- LIPID MAPS® Structure Database (LMSD)
- Chemical Classification: hierarchical classification of lipids (FA for Fatty Acyls or FA0802 for N-acyl amines).
- Comparative Toxicogenomics Database (CTD)
- GO Terms e.g. carbohydrate metabolic process or protein export from nucleus.
- Locations, as a subset of MeSH AnatomyTerms.
- Reactome
- Pathways: lowest level pathway diagram or subset of the pathway, e.g. Serine biosynthesis or Metabolism of vitamin K.
- Pathway Class: based on higher levels of the pathway hierarchy, e.g. Biological oxidations or Metabolism of vitamins and cofactors.
- PathBank
- Pathways such as Alanine Metabolism.
- Pathway class such as Physiological or Drug Metabolism.
- Panther Protein Classes: via Uniprot interactions.
- Protein interaction for Uniprot.
- Uniprot Keywords.
- PharmGKB
- Pathways: evidence-based diagrams depicting the pharmacokinetics and/or pharmacodynamics of a drug with relevant (or potential) pharmacogenetic associations.
- Therapeutic Target Database (TTD).
- Drug Indication.
- E. coli Metabolome Database (ECMDB) metabolites
- Location: subcellular locations (e.g. extracellular, cytoplasm, nucleus).
About
Data sources
MBROLE integrates information from multiple databases including chemical and biological information related to chemical compounds. In most cases these databases are public and their contents are freely available for non-commercial use. This is not the case with BioCyc and KEGG which require a paid subscription to access their most recent data.
For KEGG, data was licensed under an academic subscription for organizational use, and for BioCyc database collection, we used the versions available free of charge. Also, each database may be subject to specific terms of use, which can be found on their website.
This version of MBROLE analyzes annotations from the following databases:
- Kyoto Encyclopedia of Genes and Genomes (KEGG), release 102 (April, 2022)
- Human Metabolite Database (HMDB), version 5.0
- Yeast Metabolite Database (YMDB) (we used data from version 1.0 as we couldn't access a complete database file of version 2.0).
- PubChem, release August 2022.
- BioCyc database collection (Tier 1 and Tier 2), v.26 (EcoCyc and MetaCyc) and v.24 (rest of databases).
- Medical Subject Heading (MeSH), release from 2022.
- Chemical Entities of Biological Interest (ChEBI), release August, 2022.
- E.coli Metabolome Database (ECMDB), version 2.0.
- Therapeutic Target Database (TTD), update of September, 2021
- Comparative Toxicogenomics Database (CTD). Terms of use: [Link].
- PharmGKB, retrieved August 2022.
- PANTHER Knowledgebase, release 17.0.
- UniProt, release 2022_01.
- LIPID MAPS® Structure Database (LMSD), release from November, 2022.
- PathBank, release from 2020.
- Reactome, version 82.
Software
The dynamic interface of MBROLE is the result of combining PHP, JavaScript and CSS. Additionally, the following libraries are used: Chosen (version 1.1.0) for the selection of annotations and tablesorter (version 2.31.3) for sorting the table of results.
All data integrated in MBROLE is stored in a relational database that is queried based on the user input. The statistical calculations and the generation of plots are handled by Python scripts.
You can find more details in the publication of this version of MBROLE.
Browser Compatibility
MBROLE makes use of languagues that are standard for web development and it is expected to work in any web browser and operating system. So far, it has been checked to work with the following browsers:
- Mozilla Firefox: on Windows 10, Linux and MacOS
- Google Chrome: on Windows 10 and Linux
- Microsoft Edge: on Windows 10
- Safari: on MacOS
Using MBROLE
Use case
The following document contains two detailed use cases to highlight the potential of the server in real-world analysis scenarios: mbrole3_use_case
Tutorial
This tutorial will teach you how to perform a whole analysis with MBROLE. You can also use the "Load example" button in the analysis page to reproduce it.
Enrichment Analysis Example
We are using this set of 39 metabolites that includes KEGG compounds and MeSH descriptors.
Upload the file containing the metabolite IDs or copy and paste them in the text area. Note that IDs should be separated by tabs or new lines. Also, as there are chemical IDs from different sources, check the option: MBROLE automatic conversion.
In the next section, Annotations, choose the following annotations: Biological Roles (ChEBI), Diseases (KEGG), GO Terms (CTD), Pathways (KEGG), MeSH terms-MeSH chemicals and Panther Protein Class (HMDB).
In the section Background Set select Organism dependent. A drop-down list with all the organisms available appears. Search and select Homo Sapiens
Click on the Enrichment analysis button to start the analysis.
- Go to analysis page.
- Copy and paste or upload a local file with your set of compounds.
- Select the annotations you want to analyze.
- Choose "Homo Sapiens".
Once calculations have finished, you will get a results table with six columns summarizing results. The table is sorted by increasing "FDR" (from most to least significant). Each row contains information for a single annotation as it was explained in the Results section of the user manual. Results for Direct and Indirect annotations are separated in different sections.
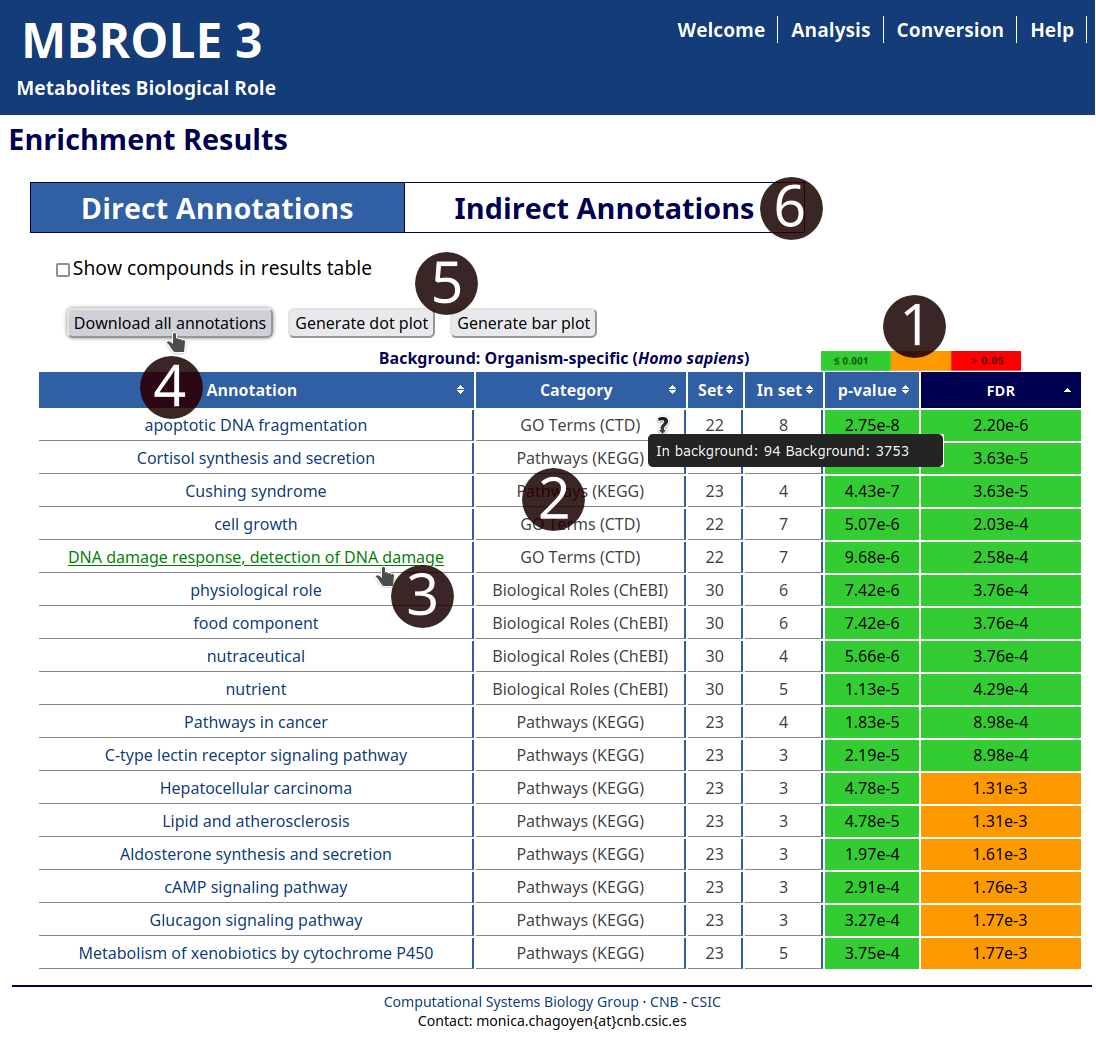
- Hovering the mouse over "p-value" and "FDR" columns reveals an image with the boundaries used to assign the color codes.
- Put the mouse over each "Category" to show info about the background used to calculate the statistics.
- Follow the link of the annotation to open its content in the source database.
- Click on "Download result table" button to export all the results to a spreadsheet program.
- Click on "Generate dot plot" or "Generate bar plot" to create plots with the most significant annotations of each category.
- Click on "Indirect Annotations" to change to the results for the other category of vocabularies.
Conversion Example:
This set of metabolites is given in terms of chemical names so they cannot be used directly in the analysis. In this example we will convert them to HMDB, KEGG and ChEBI IDs so as to perform the analysis with them.
Go to the Conversion utility and upload the file or copy-paste its content and select: "ChEBI compounds", "HMDB metabolites" and "KEGG compounds". After you click the "Search IDs" button you will get a table with four columns (see Fig. 3). The table includes the submitted metabolite, the equivalent ID(s) and its source database.
This table can be downloaded as a TSV text file clicking on "Download results" button. Once checked that the name to ID conversion is OK (and eventually corrected), you can copy/paste the column with the IDs of the compounds into the Analysis form to analyze them.
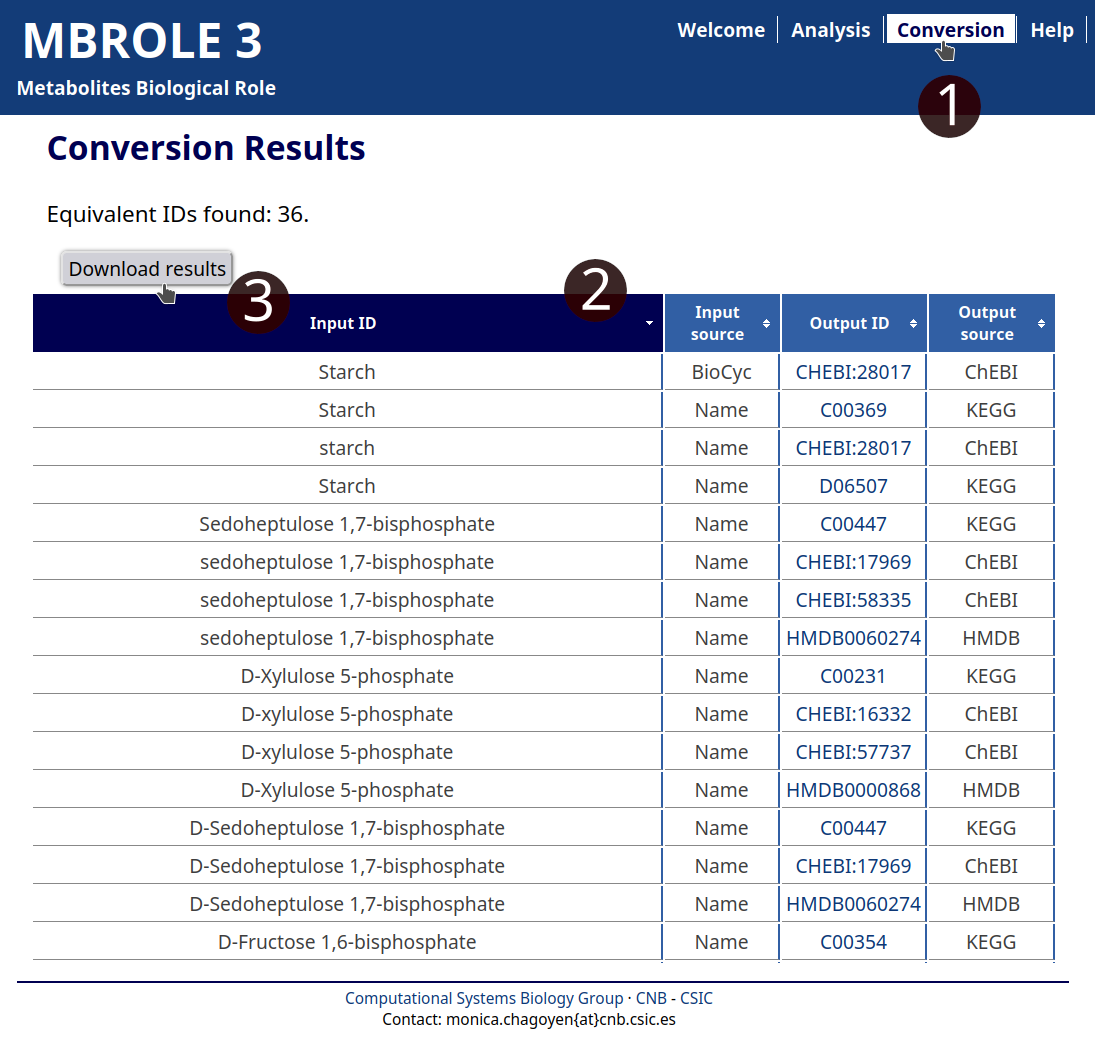
- You can access to the Conversion utility using the top menu.
- If your query returns any results you will get a table that can be sorted by clicking on any header.
- Click on "Download results" to generate a TSV plain text file that can be opened with any spreadsheet program.